正在加载图片...
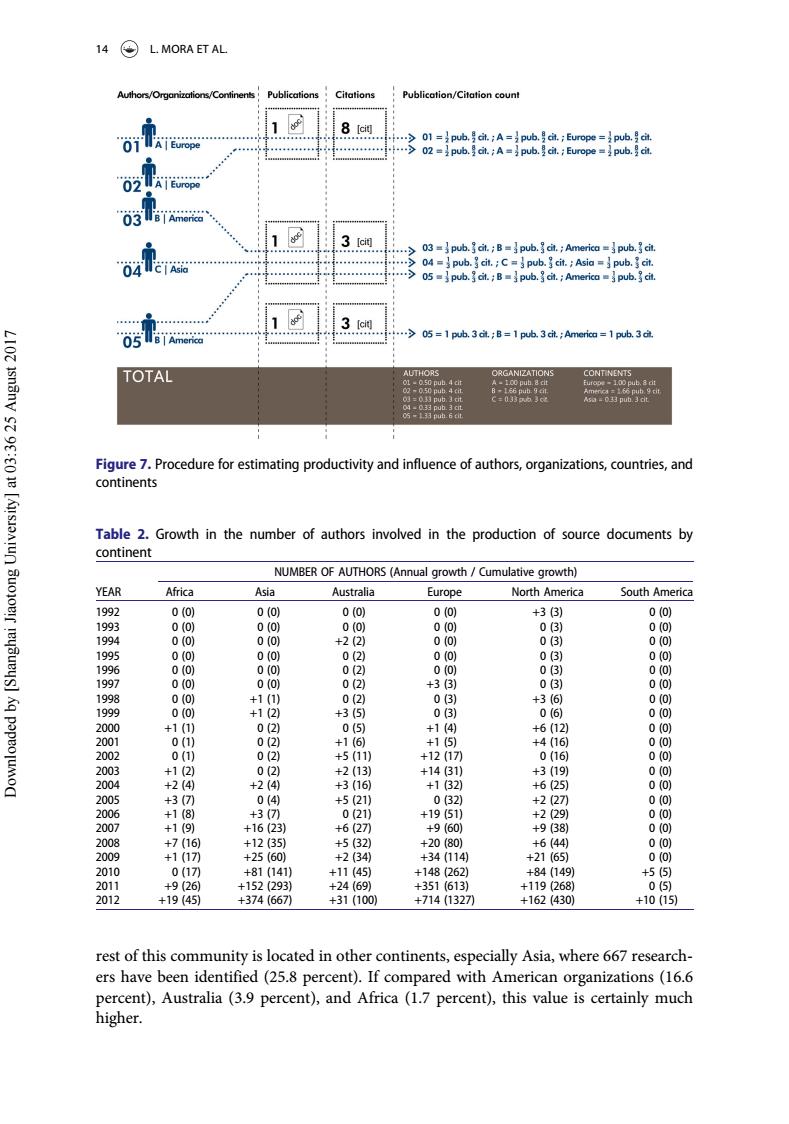
14 L.MORA ET AL Authors/Organizalions/Continents Publications Citations Publication/Citation count …>O1=}pub号t.:A=ipub.9t.;Europe=}pub.ct >02 =pub.cit.;A=pub.cit.Europe pub.cit. 02 3【ci间 03=pub.3 cit.B=pub.cit.;America pub.cit. ””9444++4+4 0.99”年+++++ .04 =3 pub.3 cit.C=3 pub.cit.Asia pub.3 cit. 05pub.cit.:Bpub.cit.;America pub.3 cit. 3 [cit ......05 1 pub.3 cit.B=1 pub.3 cit.America 1 pub.3 ct 05 TOTAL AUTHORS ORGANIZATIONS CONTINENTS =633 nuh acit Asa 033 pub.3 dt 04 -0.33 pub.3 cit LI07 1snanV st 9:E0 [AusaAlun Suoloe!f yueyS]q papeojumod Figure 7.Procedure for estimating productivity and influence of authors,organizations,countries,and continents Table 2.Growth in the number of authors involved in the production of source documents by continent NUMBER OF AUTHORS(Annual growth /Cumulative growth) YEAR Africa Asia Australia Europe North America South America 1992 0(0) 0(0) 0(0) 0(0) +3(3) 0(0) 1993 0(0) 0(0) 0(0) 0(0) 0(3) 0(0) 1994 0(0) 0(0) +2(2) 0(0) 0(3) 0(0) 1995 0(0) 0(0) 0(2) 0(0) 0(3) 0(0) 1996 0(0) 0(0) 0(2) 0(0) 0(3) 0(0) 1997 0(0) 0(0) 0(2) +3(3) 03) 0(0) 1998 0(0) +1(1) 0(2) 0(3) +3(6) 0(0) 1999 0(0) +1(2) +3(5) 0(3) 0(6) 0(0) 2000 +1(1) 0(2 0(5) +1(④) +6(12) 0(0) 2001 0() 0(2) +1(6) +1(5) +4(16) 0(0) 2002 0(1)) 0(2) +5(11) +12(17) 0(16) 0(0) 2003 +1(2) 0(2) +2(13) +14(31) +3(19) 0(0) 2004 +2(④ +2(4) +3(16 +1(32) +6(25) 0(0) 2005 0(4 +5(21) 0(32) +2 (27) 0(0) 2006 +3(7) 0(21) +19(51) +2(29) 0(0) 2007 +1 9 +16(23) +6(27) +9(60) +9(38) 0(0) 2008 +7(1 +12(35) +5(32) +20(80) +6(44) 0(0) 2009 +1(17) +25(60) +2(34) +34(114) +21(65) 0(0) 2010 0(17) +81(141) +11(45) +148(262) +84(149 +5(5⑤) 2011 +926 +152(293) +24(69) +351(613) +119(268) 0(5 2012 +19(45) +374(667) +31(100) +714(1327) +162(430) +10(15) rest of this community is located in other continents,especially Asia,where 667 research- ers have been identified(25.8 percent).If compared with American organizations(16.6 percent),Australia(3.9 percent),and Africa (1.7 percent),this value is certainly much higher.rest of this community is located in other continents, especially Asia, where 667 researchers have been identified (25.8 percent). If compared with American organizations (16.6 percent), Australia (3.9 percent), and Africa (1.7 percent), this value is certainly much higher. Figure 7. Procedure for estimating productivity and influence of authors, organizations, countries, and continents Table 2. Growth in the number of authors involved in the production of source documents by continent YEAR NUMBER OF AUTHORS (Annual growth / Cumulative growth) Africa Asia Australia Europe North America South America 1992 0 (0) 0 (0) 0 (0) 0 (0) +3 (3) 0 (0) 1993 0 (0) 0 (0) 0 (0) 0 (0) 0 (3) 0 (0) 1994 0 (0) 0 (0) +2 (2) 0 (0) 0 (3) 0 (0) 1995 0 (0) 0 (0) 0 (2) 0 (0) 0 (3) 0 (0) 1996 0 (0) 0 (0) 0 (2) 0 (0) 0 (3) 0 (0) 1997 0 (0) 0 (0) 0 (2) +3 (3) 0 (3) 0 (0) 1998 0 (0) +1 (1) 0 (2) 0 (3) +3 (6) 0 (0) 1999 0 (0) +1 (2) +3 (5) 0 (3) 0 (6) 0 (0) 2000 +1 (1) 0 (2) 0 (5) +1 (4) +6 (12) 0 (0) 2001 0 (1) 0 (2) +1 (6) +1 (5) +4 (16) 0 (0) 2002 0 (1) 0 (2) +5 (11) +12 (17) 0 (16) 0 (0) 2003 +1 (2) 0 (2) +2 (13) +14 (31) +3 (19) 0 (0) 2004 +2 (4) +2 (4) +3 (16) +1 (32) +6 (25) 0 (0) 2005 +3 (7) 0 (4) +5 (21) 0 (32) +2 (27) 0 (0) 2006 +1 (8) +3 (7) 0 (21) +19 (51) +2 (29) 0 (0) 2007 +1 (9) +16 (23) +6 (27) +9 (60) +9 (38) 0 (0) 2008 +7 (16) +12 (35) +5 (32) +20 (80) +6 (44) 0 (0) 2009 +1 (17) +25 (60) +2 (34) +34 (114) +21 (65) 0 (0) 2010 0 (17) +81 (141) +11 (45) +148 (262) +84 (149) +5 (5) 2011 +9 (26) +152 (293) +24 (69) +351 (613) +119 (268) 0 (5) 2012 +19 (45) +374 (667) +31 (100) +714 (1327) +162 (430) +10 (15) 14 L. MORA ET AL. Downloaded by [Shanghai Jiaotong University] at 03:36 25 August 2017