正在加载图片...
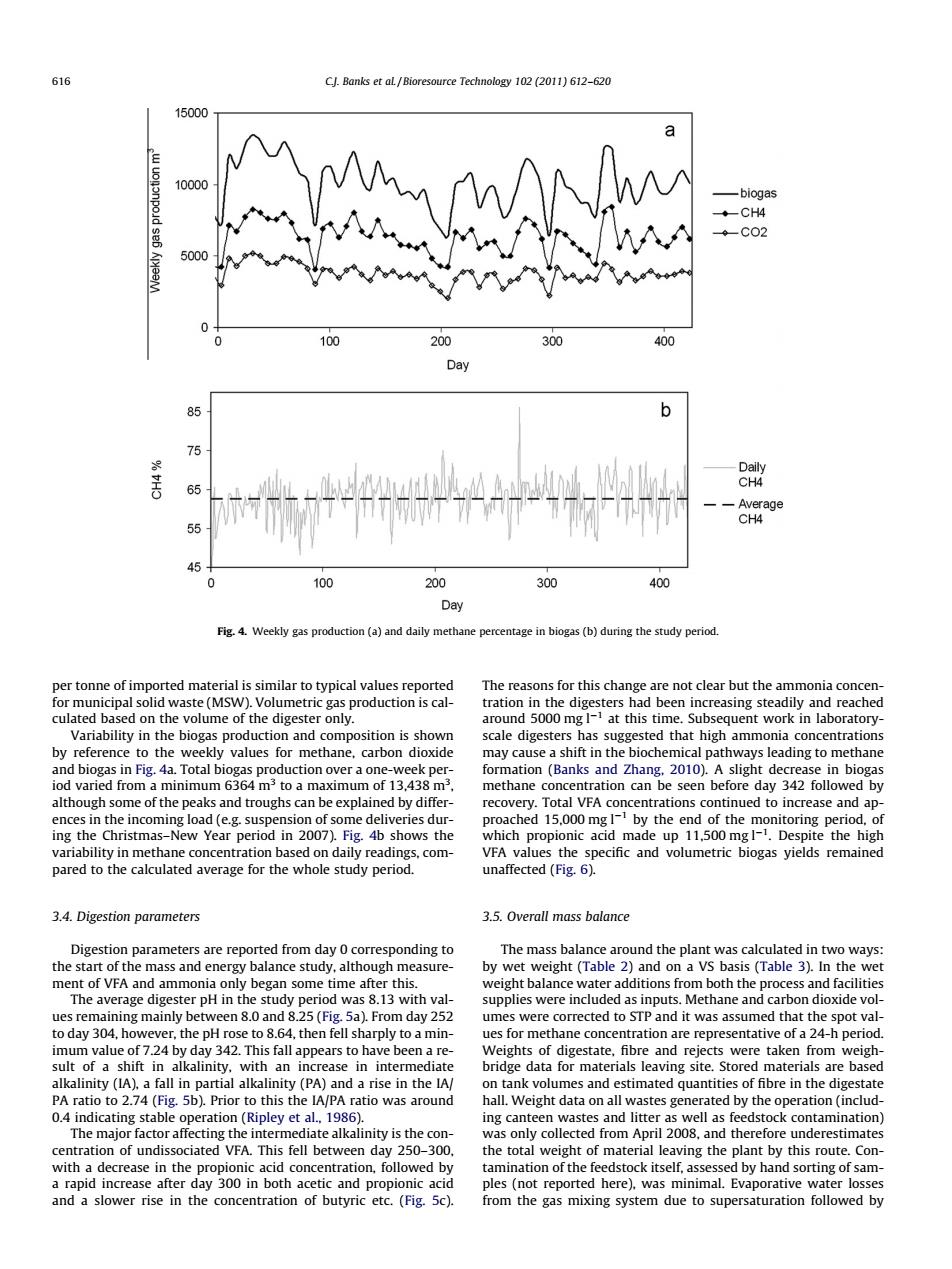
616 CJ.Banks et al /Bioresource Technology 102(2011)612-620 15000 10000 -biogas ◆-CH4 ◆-C02 5000 100 200 300 400 Day 6 b 75 CM 65 -Average CH4 55 45 100 200 300 400 Day Fig.4.Weekly gas production(a)and daily methane percentage in biogas(b)during the study period. per tonne of imported material is similar to typical values reported The reasons for this change are not clear but the ammonia concen- for municipal solid waste(MSW).Volumetric gas production is cal- tration in the digesters had been increasing steadily and reached culated based on the volume of the digester only. around 5000 mg I-1 at this time.Subsequent work in laboratory- Variability in the biogas production and composition is shown scale digesters has suggested that high ammonia concentrations by reference to the weekly values for methane,carbon dioxide may cause a shift in the biochemical pathways leading to methane and biogas in Fig.4a.Total biogas production over a one-week per- formation (Banks and Zhang,2010).A slight decrease in biogas iod varied from a minimum 6364 m3 to a maximum of 13,438 m3 methane concentration can be seen before day 342 followed by although some of the peaks and troughs can be explained by differ- recovery.Total VFA concentrations continued to increase and ap- ences in the incoming load (e.g.suspension of some deliveries dur- proached 15.000 mgl-1 by the end of the monitoring period.of ing the Christmas-New Year period in 2007).Fig.4b shows the which propionic acid made up 11,500 mgI-.Despite the high variability in methane concentration based on daily readings,com- VFA values the specific and volumetric biogas yields remained pared to the calculated average for the whole study period. unaffected (Fig.6). 3.4.Digestion parameters 3.5.Overall mass balance Digestion parameters are reported from day 0 corresponding to The mass balance around the plant was calculated in two ways: the start of the mass and energy balance study,although measure- by wet weight (Table 2)and on a VS basis (Table 3).In the wet ment of VFA and ammonia only began some time after this. weight balance water additions from both the process and facilities The average digester pH in the study period was 8.13 with val- supplies were included as inputs.Methane and carbon dioxide vol- ues remaining mainly between 8.0 and 8.25(Fig.5a).From day 252 umes were corrected to STP and it was assumed that the spot val- to day 304,however,the pH rose to 8.64,then fell sharply to a min- ues for methane concentration are representative of a 24-h period. imum value of 7.24 by day 342.This fall appears to have been a re- Weights of digestate,fibre and rejects were taken from weigh- sult of a shift in alkalinity,with an increase in intermediate bridge data for materials leaving site.Stored materials are based alkalinity(IA).a fall in partial alkalinity (PA)and a rise in the IA/ on tank volumes and estimated quantities of fibre in the digestate PA ratio to 2.74(Fig.5b).Prior to this the IA/PA ratio was around hall.Weight data on all wastes generated by the operation (includ- 0.4 indicating stable operation (Ripley et al.,1986). ing canteen wastes and litter as well as feedstock contamination) The major factor affecting the intermediate alkalinity is the con was only collected from April 2008,and therefore underestimates centration of undissociated VFA.This fell between day 250-300. the total weight of material leaving the plant by this route.Con- with a decrease in the propionic acid concentration,followed by tamination of the feedstock itself,assessed by hand sorting of sam- a rapid increase after day 300 in both acetic and propionic acid ples(not reported here).was minimal.Evaporative water losses and a slower rise in the concentration of butyric etc.(Fig.5c). from the gas mixing system due to supersaturation followed byper tonne of imported material is similar to typical values reported for municipal solid waste (MSW). Volumetric gas production is calculated based on the volume of the digester only. Variability in the biogas production and composition is shown by reference to the weekly values for methane, carbon dioxide and biogas in Fig. 4a. Total biogas production over a one-week period varied from a minimum 6364 m3 to a maximum of 13,438 m3 , although some of the peaks and troughs can be explained by differences in the incoming load (e.g. suspension of some deliveries during the Christmas–New Year period in 2007). Fig. 4b shows the variability in methane concentration based on daily readings, compared to the calculated average for the whole study period. 3.4. Digestion parameters Digestion parameters are reported from day 0 corresponding to the start of the mass and energy balance study, although measurement of VFA and ammonia only began some time after this. The average digester pH in the study period was 8.13 with values remaining mainly between 8.0 and 8.25 (Fig. 5a). From day 252 to day 304, however, the pH rose to 8.64, then fell sharply to a minimum value of 7.24 by day 342. This fall appears to have been a result of a shift in alkalinity, with an increase in intermediate alkalinity (IA), a fall in partial alkalinity (PA) and a rise in the IA/ PA ratio to 2.74 (Fig. 5b). Prior to this the IA/PA ratio was around 0.4 indicating stable operation (Ripley et al., 1986). The major factor affecting the intermediate alkalinity is the concentration of undissociated VFA. This fell between day 250–300, with a decrease in the propionic acid concentration, followed by a rapid increase after day 300 in both acetic and propionic acid and a slower rise in the concentration of butyric etc. (Fig. 5c). The reasons for this change are not clear but the ammonia concentration in the digesters had been increasing steadily and reached around 5000 mg l1 at this time. Subsequent work in laboratoryscale digesters has suggested that high ammonia concentrations may cause a shift in the biochemical pathways leading to methane formation (Banks and Zhang, 2010). A slight decrease in biogas methane concentration can be seen before day 342 followed by recovery. Total VFA concentrations continued to increase and approached 15,000 mg l1 by the end of the monitoring period, of which propionic acid made up 11,500 mg l1 . Despite the high VFA values the specific and volumetric biogas yields remained unaffected (Fig. 6). 3.5. Overall mass balance The mass balance around the plant was calculated in two ways: by wet weight (Table 2) and on a VS basis (Table 3). In the wet weight balance water additions from both the process and facilities supplies were included as inputs. Methane and carbon dioxide volumes were corrected to STP and it was assumed that the spot values for methane concentration are representative of a 24-h period. Weights of digestate, fibre and rejects were taken from weighbridge data for materials leaving site. Stored materials are based on tank volumes and estimated quantities of fibre in the digestate hall. Weight data on all wastes generated by the operation (including canteen wastes and litter as well as feedstock contamination) was only collected from April 2008, and therefore underestimates the total weight of material leaving the plant by this route. Contamination of the feedstock itself, assessed by hand sorting of samples (not reported here), was minimal. Evaporative water losses from the gas mixing system due to supersaturation followed by Fig. 4. Weekly gas production (a) and daily methane percentage in biogas (b) during the study period. 616 C.J. Banks et al. / Bioresource Technology 102 (2011) 612–620���