正在加载图片...
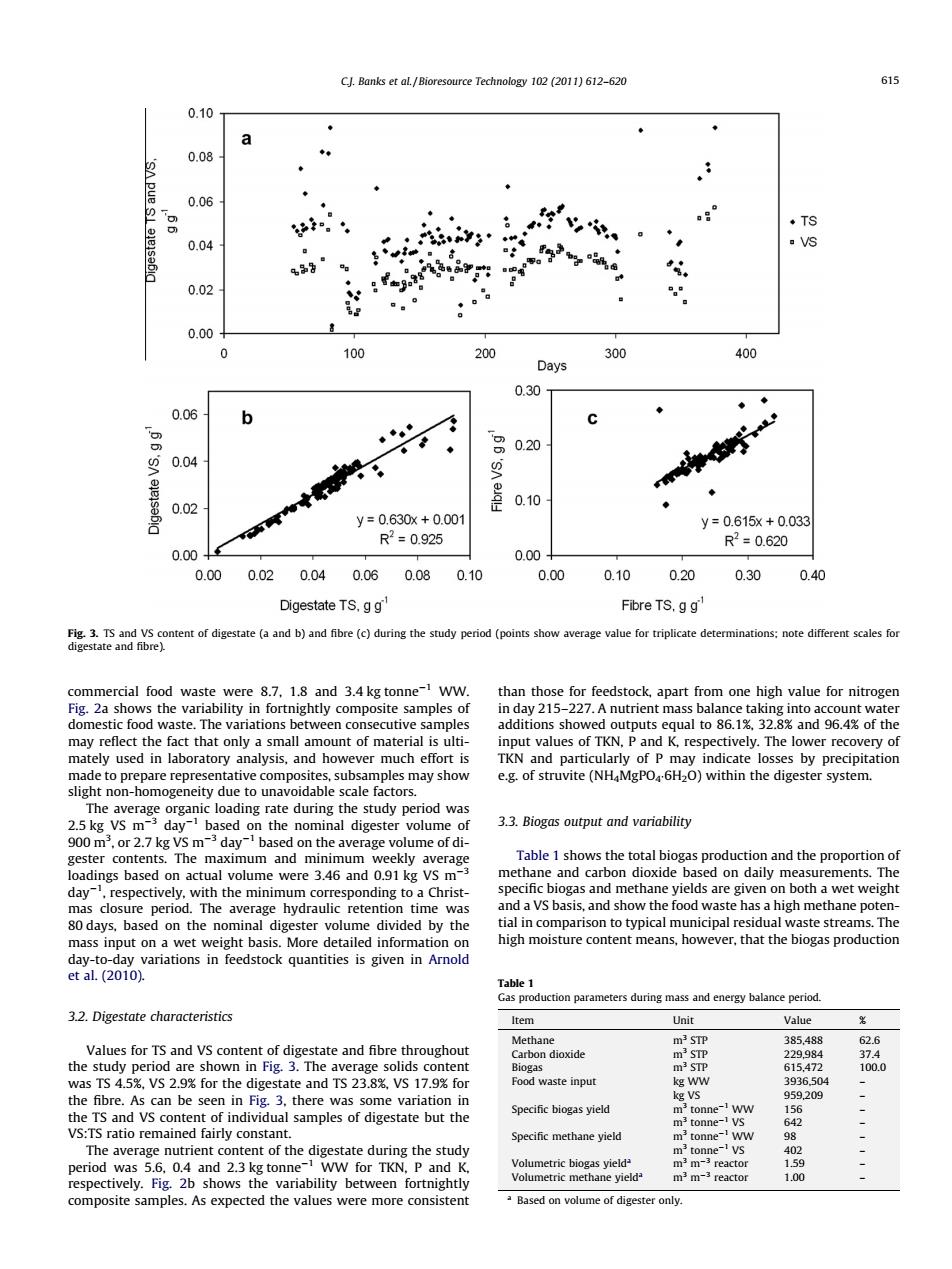
CJ.Banks et al./Bioresource Technology 102 (2011)612-620 615 0.10 a 0.08 pue 0.06 o 以。 00 ◆TS 0.04 ▣VS 4品 0.02 0.00+ 0 100 200 300 400 Days 0.30 ◆ 0.06 b ) 0.20 9 0.04 0.02 ejql 0.10 y=0.630x+0.001 y=0.615x+0.033 R2=0.925 R2=0.620 0.00+ 0.00+ 0.00 0.02 0.04 0.06 0.08 0.10 0.00 0.10 0.20 0.30 0.40 Digestate TS.gg Fibre TS.gg Fig.3.TS and VS content of digestate (a and b)and fibre(c)during the study period(points show average value for triplicate determinations:note different scales for digestate and fibre). commercial food waste were 8.7,1.8 and 3.4 kg tonne-1 WW. than those for feedstock,apart from one high value for nitrogen Fig.2a shows the variability in fortnightly composite samples of in day 215-227.A nutrient mass balance taking into account water domestic food waste.The variations between consecutive samples additions showed outputs equal to 86.1%,32.8%and 96.4%of the may reflect the fact that only a small amount of material is ulti- input values of TKN,P and K,respectively.The lower recovery of mately used in laboratory analysis,and however much effort is TKN and particularly of P may indicate losses by precipitation made to prepare representative composites,subsamples may show e.g.of struvite(NH4MgPO6H2O)within the digester system. slight non-homogeneity due to unavoidable scale factors. The average organic loading rate during the study period was 2.5 kg Vs m-3 day-1 based on the nominal digester volume of 3.3.Biogas output and variability 900 m',or 2.7 kg VS m day-'based on the average volume of di- gester contents.The maximum and minimum weekly average Table 1 shows the total biogas production and the proportion of loadings based on actual volume were 3.46 and 0.91 kg VS m methane and carbon dioxide based on daily measurements.The day-,respectively,with the minimum corresponding to a Christ- specific biogas and methane yields are given on both a wet weight mas closure period.The average hydraulic retention time was and a VS basis,and show the food waste has a high methane poten- 80 days,based on the nominal digester volume divided by the tial in comparison to typical municipal residual waste streams.The mass input on a wet weight basis.More detailed information on high moisture content means,however,that the biogas production day-to-day variations in feedstock quantities is given in Arnold etal.(2010). Table 1 Gas production parameters during mass and energy balance period. 3.2.Digestate characteristics Item Unit Value 黑 Methane m3STP 385,488 62.6 Values for TS and VS content of digestate and fibre throughout Carbon dioxide mSTP 229984 37.4 the study period are shown in Fig.3.The average solids content Biogas m3 STP 615,472 100.0 was TS 4.5%,VS 2.9%for the digestate and TS 23.8%,VS 17.9%for Food waste input kg ww 3936.504 the fibre.As can be seen in Fig.3.there was some variation in kg VS 959.209 m3tonne-1wW 156 the TS and VS content of individual samples of digestate but the Specific biogas yield m3 tonne-1 VS 642 VS:TS ratio remained fairly constant. Specific methane yield m3tonne-1ww 98 The average nutrient content of the digestate during the study mtonne-1Vs 402 period was 5.6.0.4 and 2.3 kg tonne-1 WW for TKN.P and K. Volumetric biogas yield m m-3 reactor 1.59 respectively.Fig.2b shows the variability between fortnightly Volumetric methane yielda m3m-3 reactor 1.00 composite samples.As expected the values were more consistent a Based on volume of digester only.commercial food waste were 8.7, 1.8 and 3.4 kg tonne1 WW. Fig. 2a shows the variability in fortnightly composite samples of domestic food waste. The variations between consecutive samples may reflect the fact that only a small amount of material is ultimately used in laboratory analysis, and however much effort is made to prepare representative composites, subsamples may show slight non-homogeneity due to unavoidable scale factors. The average organic loading rate during the study period was 2.5 kg VS m3 day1 based on the nominal digester volume of 900 m3 , or 2.7 kg VS m3 day1 based on the average volume of digester contents. The maximum and minimum weekly average loadings based on actual volume were 3.46 and 0.91 kg VS m3 day1 , respectively, with the minimum corresponding to a Christmas closure period. The average hydraulic retention time was 80 days, based on the nominal digester volume divided by the mass input on a wet weight basis. More detailed information on day-to-day variations in feedstock quantities is given in Arnold et al. (2010). 3.2. Digestate characteristics Values for TS and VS content of digestate and fibre throughout the study period are shown in Fig. 3. The average solids content was TS 4.5%, VS 2.9% for the digestate and TS 23.8%, VS 17.9% for the fibre. As can be seen in Fig. 3, there was some variation in the TS and VS content of individual samples of digestate but the VS:TS ratio remained fairly constant. The average nutrient content of the digestate during the study period was 5.6, 0.4 and 2.3 kg tonne1 WW for TKN, P and K, respectively. Fig. 2b shows the variability between fortnightly composite samples. As expected the values were more consistent than those for feedstock, apart from one high value for nitrogen in day 215–227. A nutrient mass balance taking into account water additions showed outputs equal to 86.1%, 32.8% and 96.4% of the input values of TKN, P and K, respectively. The lower recovery of TKN and particularly of P may indicate losses by precipitation e.g. of struvite (NH4MgPO46H2O) within the digester system. 3.3. Biogas output and variability Table 1 shows the total biogas production and the proportion of methane and carbon dioxide based on daily measurements. The specific biogas and methane yields are given on both a wet weight and a VS basis, and show the food waste has a high methane potential in comparison to typical municipal residual waste streams. The high moisture content means, however, that the biogas production Fig. 3. TS and VS content of digestate (a and b) and fibre (c) during the study period (points show average value for triplicate determinations; note different scales for digestate and fibre). Table 1 Gas production parameters during mass and energy balance period. Item Unit Value % Methane m3 STP 385,488 62.6 Carbon dioxide m3 STP 229,984 37.4 Biogas m3 STP 615,472 100.0 Food waste input kg WW 3936,504 – kg VS 959,209 – Specific biogas yield m3 tonne1 WW 156 – m3 tonne1 VS 642 – Specific methane yield m3 tonne1 WW 98 – m3 tonne1 VS 402 – Volumetric biogas yielda m3 m3 reactor 1.59 – Volumetric methane yielda m3 m3 reactor 1.00 – a Based on volume of digester only. C.J. Banks et al. / Bioresource Technology 102 (2011) 612–620 615���������������