正在加载图片...
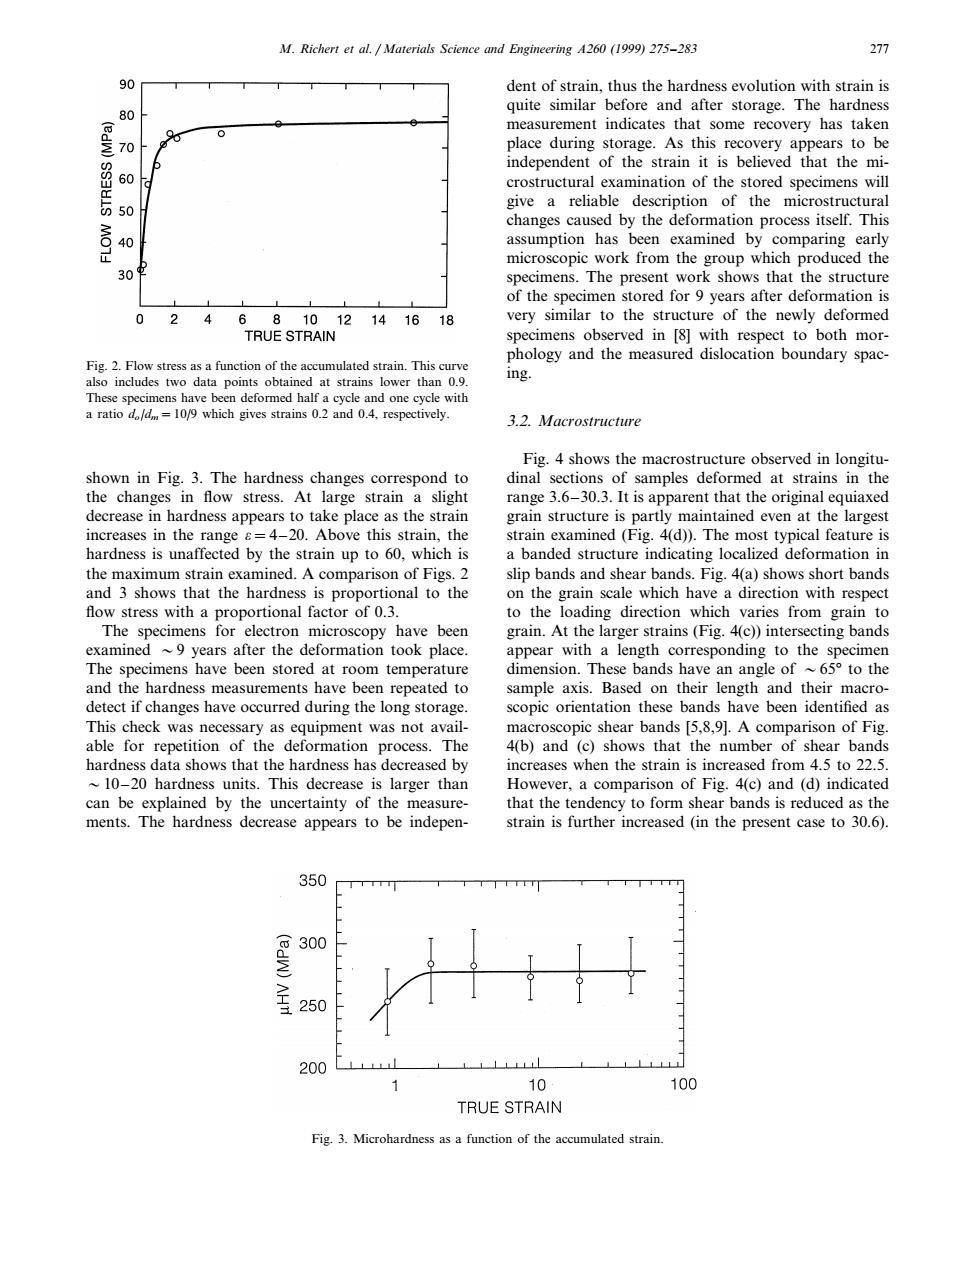
M.Richert et al.Materials Science and Engineering A260 (1999)275-283 277 90 dent of strain,thus the hardness evolution with strain is 80 quite similar before and after storage.The hardness measurement indicates that some recovery has taken 70 place during storage.As this recovery appears to be independent of the strain it is believed that the mi- 60 crostructural examination of the stored specimens will give a reliable description of the microstructural MO changes caused by the deformation process itself.This 0 assumption has been examined by comparing early microscopic work from the group which produced the 30 specimens.The present work shows that the structure of the specimen stored for 9 years after deformation is 0 4 681012141618 very similar to the structure of the newly deformed TRUE STRAIN specimens observed in [8]with respect to both mor- phology and the measured dislocation boundary spac- Fig.2.Flow stress as a function of the accumulated strain.This curve also includes two data points obtained at strains lower than 0.9. ing These specimens have been deformed half a cycle and one cycle with a ratio dod=10/9 which gives strains 0.2 and 0.4,respectively. 3.2.Macrostructure Fig.4 shows the macrostructure observed in longitu- shown in Fig.3.The hardness changes correspond to dinal sections of samples deformed at strains in the the changes in flow stress.At large strain a slight range 3.6-30.3.It is apparent that the original equiaxed decrease in hardness appears to take place as the strain grain structure is partly maintained even at the largest increases in the range s=4-20.Above this strain,the strain examined(Fig.4(d)).The most typical feature is hardness is unaffected by the strain up to 60,which is a banded structure indicating localized deformation in the maximum strain examined.A comparison of Figs.2 slip bands and shear bands.Fig.4(a)shows short bands and 3 shows that the hardness is proportional to the on the grain scale which have a direction with respect flow stress with a proportional factor of 0.3. to the loading direction which varies from grain to The specimens for electron microscopy have been grain.At the larger strains(Fig.4(c))intersecting bands examined ~9 years after the deformation took place. appear with a length corresponding to the specimen The specimens have been stored at room temperature dimension.These bands have an angle of ~65 to the and the hardness measurements have been repeated to sample axis.Based on their length and their macro- detect if changes have occurred during the long storage. scopic orientation these bands have been identified as This check was necessary as equipment was not avail- macroscopic shear bands [5,8,9].A comparison of Fig. able for repetition of the deformation process.The 4(b)and (c)shows that the number of shear bands hardness data shows that the hardness has decreased by increases when the strain is increased from 4.5 to 22.5. 10-20 hardness units.This decrease is larger than However,a comparison of Fig.4(c)and(d)indicated can be explained by the uncertainty of the measure- that the tendency to form shear bands is reduced as the ments.The hardness decrease appears to be indepen- strain is further increased (in the present case to 30.6). 350 300 250 200 10 100 TRUE STRAIN Fig.3.Microhardness as a function of the accumulated strain.M. Richert et al. / Materials Science and Engineering A260 (1999) 275–283 277 Fig. 2. Flow stress as a function of the accumulated strain. This curve also includes two data points obtained at strains lower than 0.9. These specimens have been deformed half a cycle and one cycle with a ratio do/dm=10/9 which gives strains 0.2 and 0.4, respectively. dent of strain, thus the hardness evolution with strain is quite similar before and after storage. The hardness measurement indicates that some recovery has taken place during storage. As this recovery appears to be independent of the strain it is believed that the microstructural examination of the stored specimens will give a reliable description of the microstructural changes caused by the deformation process itself. This assumption has been examined by comparing early microscopic work from the group which produced the specimens. The present work shows that the structure of the specimen stored for 9 years after deformation is very similar to the structure of the newly deformed specimens observed in [8] with respect to both morphology and the measured dislocation boundary spacing. 3.2. Macrostructure Fig. 4 shows the macrostructure observed in longitudinal sections of samples deformed at strains in the range 3.6–30.3. It is apparent that the original equiaxed grain structure is partly maintained even at the largest strain examined (Fig. 4(d)). The most typical feature is a banded structure indicating localized deformation in slip bands and shear bands. Fig. 4(a) shows short bands on the grain scale which have a direction with respect to the loading direction which varies from grain to grain. At the larger strains (Fig. 4(c)) intersecting bands appear with a length corresponding to the specimen dimension. These bands have an angle of 65° to the sample axis. Based on their length and their macroscopic orientation these bands have been identified as macroscopic shear bands [5,8,9]. A comparison of Fig. 4(b) and (c) shows that the number of shear bands increases when the strain is increased from 4.5 to 22.5. However, a comparison of Fig. 4(c) and (d) indicated that the tendency to form shear bands is reduced as the strain is further increased (in the present case to 30.6). shown in Fig. 3. The hardness changes correspond to the changes in flow stress. At large strain a slight decrease in hardness appears to take place as the strain increases in the range o=4–20. Above this strain, the hardness is unaffected by the strain up to 60, which is the maximum strain examined. A comparison of Figs. 2 and 3 shows that the hardness is proportional to the flow stress with a proportional factor of 0.3. The specimens for electron microscopy have been examined 9 years after the deformation took place. The specimens have been stored at room temperature and the hardness measurements have been repeated to detect if changes have occurred during the long storage. This check was necessary as equipment was not available for repetition of the deformation process. The hardness data shows that the hardness has decreased by 10–20 hardness units. This decrease is larger than can be explained by the uncertainty of the measurements. The hardness decrease appears to be indepenFig. 3. Microhardness as a function of the accumulated strain.���