正在加载图片...
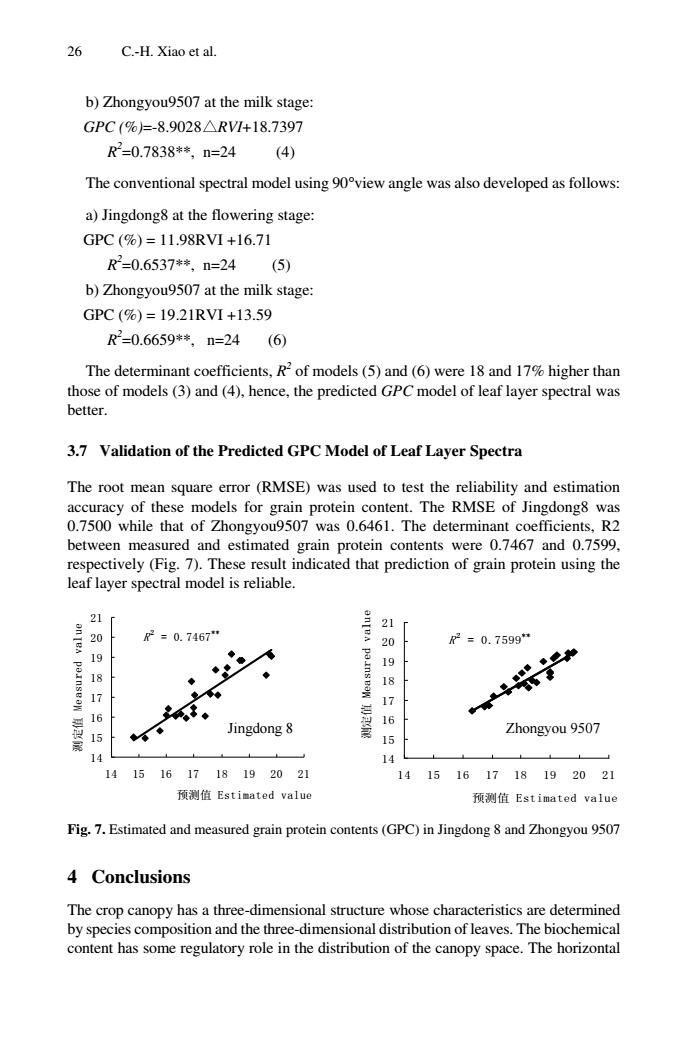
26 C.-H.Xiao et al b)Zhongyou9507 at the milk stage GPC(%)=-8.9028△RV1+18.7397 R2-0.7838*,n=24 (4) The conventional spectral model using 90view angle was also developed as follows: a)Jingdong8 at the flowering stage: GPC(%)=11.98RVI+16.71 R2=0.6537*,n=24 b)Zhongyou9507 at the milk stage GPC(%)=19.21RVI+13.59 R2-0.6659*,n=24 (6 The determinant coefficients.R2of models(5)and(6)were 18 and 17%higher than those of models (3)and(4),hence,the predicted GPC model of leaf layer spectral was better 3.7 Validation of the Predicted GPC Model of Leaf Laver Spectra The root mean square error (RMSE)was used to test the reliability and estimation accuracy of these models for grain protein content The rmse of lingdong&wa 0.7500 while that of Zho minan coefficie nts R2 between me ired and estimated 7and0.759g respectively (Fig.7).T indicated that prediction of grain protein using the leaf layer spectral model is reliable. 2=0.7467 20 R2=0.7599 19 19 17 Jingdong 8 Zhongyou 9507 14 149 1415161718192021 1415161718192021 预测值Estimated valy 预测值Estimated value Fig.7.Estimated and measured grain protein contents(GPC)in Jingdong 8 and Zhongyou 9507 4 Conclusions The crop canopy has a three-dimensional structure whose characteristics are determined by spec position and the three-dimensional distribution of leaves.The biochemical co regu alatory role in the distribution of the canopy space.The horizontal 26 C.-H. Xiao et al. b) Zhongyou9507 at the milk stage: GPC (%)=-8.9028△RVI+18.7397 R2 =0.7838**, n=24 (4) The conventional spectral model using 90°view angle was also developed as follows: a) Jingdong8 at the flowering stage: GPC (%) = 11.98RVI +16.71 R2 =0.6537**, n=24 (5) b) Zhongyou9507 at the milk stage: GPC (%) = 19.21RVI +13.59 R2 =0.6659**, n=24 (6) The determinant coefficients, R2 of models (5) and (6) were 18 and 17% higher than those of models (3) and (4), hence, the predicted GPC model of leaf layer spectral was better. 3.7 Validation of the Predicted GPC Model of Leaf Layer Spectra The root mean square error (RMSE) was used to test the reliability and estimation accuracy of these models for grain protein content. The RMSE of Jingdong8 was 0.7500 while that of Zhongyou9507 was 0.6461. The determinant coefficients, R2 between measured and estimated grain protein contents were 0.7467 and 0.7599, respectively (Fig. 7). These result indicated that prediction of grain protein using the leaf layer spectral model is reliable. 5
乘⌟ؐ(VWLPDWHGYDOXH ⌟ᅮؐ0HDVXUHGYDOXH 5
乘⌟ؐ(VWLPDWHGYDOXH ⌟ᅮؐ0HDVXUHGYDOXH Jingdong 8 Zhongyou 9507 Fig. 7. Estimated and measured grain protein contents (GPC) in Jingdong 8 and Zhongyou 9507 4 Conclusions The crop canopy has a three-dimensional structure whose characteristics are determined by species composition and the three-dimensional distribution of leaves. The biochemical content has some regulatory role in the distribution of the canopy space. The horizontal ������������