正在加载图片...
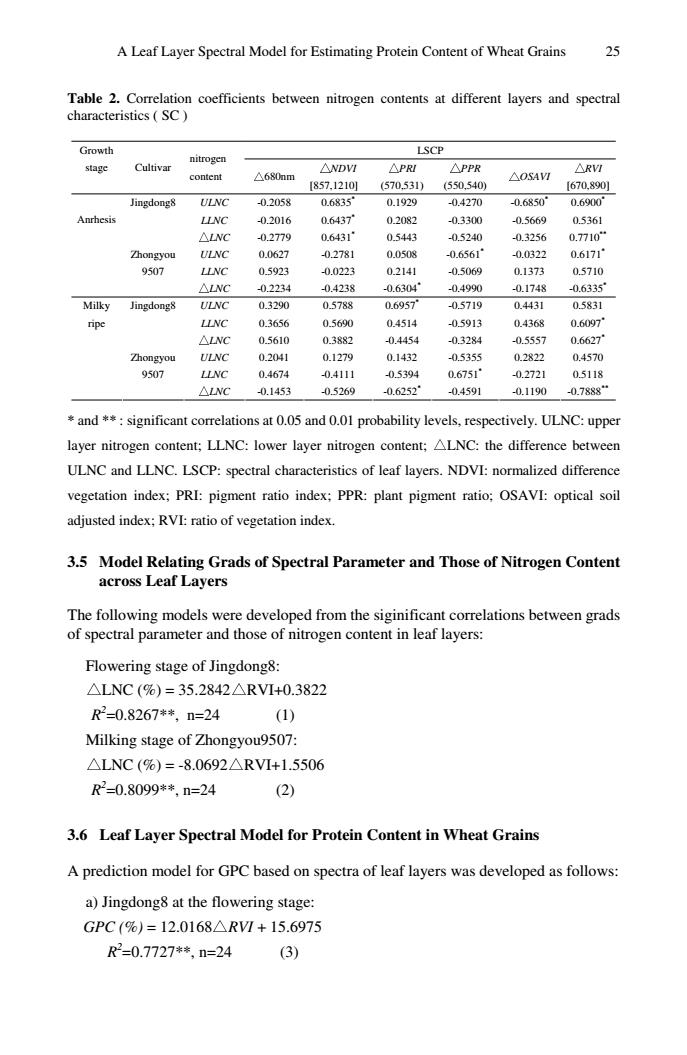
A Leaf Layer Spectral Model for Estimating Protein Content of Wheat Grains Table 2.Correlatio coefficients between nitrogen contents at different layers and spectral (SC) LSCP stage Cultivar ANDVE 人Rn ontent △680mm 18571210 (570.531)(550.540 △OSA7 1670.890 Jingdong8 ULNC -0.2058 0.6835 0.1929 -0.4270 0.6850° 0.6900 Anrhesis LLNC 0.2016 0.6437 02082 0.3300 -0.5669 0.5361 0.2779 0.6431 0.5443 0.5240 -03256 0.7710 Zhongyou ULN 0.062 -0.278 0.050 -0.6561 -0.0321 0.6171 9507 0.59 0022 0.214 0.37 02041 01320 04570 9507 LNC 04674 -04111 05394 06751" 02721 05118 △LNC 0.1453 0.5269 06252 0.4591 -0.1190 0.7888 and:significant correlations and 0.01 probability levels,respectively.ULNC:upper layer nitrogen content:LLNC:lower layer nitrogen content:ALNC:the difference between ULNC and LLNC.LSCP:spectral characteristics of leaf layers.NDVI:normalized difference vegetation index;PRI:pigment ratio index;PPR:plant pigment ratio:OSAVI:optical soil adjusted index:RVI ratio of vegetation index 3.5 Model Relating Grads of Spectral Parameter and Those of Nitrogen Content across Leaf Layers The following models were developed from the siginificant correlations between grads of spectral parameter and those of nitrogen content in leaf layers: Flowering stage of Jingdong8: △LNC(%)=35.2842△RVI1+0.3822 R=0.8267**,n=24 (1) Milking stage of Zhongyou9507: △LNC(%)=-8.0692△RVI+1.5506 R2-0.8099**,n=24 (2) 3.6 Leaf Layer Spectral Model for Protein Content in Wheat Grains A prediction model for GPC based on spectra of leaf layers was developed as follows a)Jingdong8 at the flowering stage: GPC1%)=12.0168△RVM+15.6975 R2=0.7727*,n=24 (3)A Leaf Layer Spectral Model for Estimating Protein Content of Wheat Grains 25 Table 2. Correlation coefficients between nitrogen contents at different layers and spectral characteristics ( SC ) Growth LSCP stage Cultivar nitrogen content 680nm NDVI [857,1210] PRI (570,531) PPR (550,540) OSAVI RVI [670,890] ULNC -0.2058 0.6835* 0.1929 -0.4270 -0.6850* 0.6900* LLNC -0.2016 0.6437* 0.2082 -0.3300 -0.5669 0.5361 Jingdong8 LNC -0.2779 0.6431* 0.5443 -0.5240 -0.3256 0.7710** ULNC 0.0627 -0.2781 0.0508 -0.6561* -0.0322 0.6171* LLNC 0.5923 -0.0223 0.2141 -0.5069 0.1373 0.5710 Anrhesis Zhongyou 9507 LNC -0.2234 -0.4238 -0.6304* -0.4990 -0.1748 -0.6335* ULNC 0.3290 0.5788 0.6957* -0.5719 0.4431 0.5831 LLNC 0.3656 0.5690 0.4514 -0.5913 0.4368 0.6097* Jingdong8 LNC 0.5610 0.3882 -0.4454 -0.3284 -0.5557 0.6627* ULNC 0.2041 0.1279 0.1432 -0.5355 0.2822 0.4570 LLNC 0.4674 -0.4111 -0.5394 0.6751* -0.2721 0.5118 Milky ripe Zhongyou 9507 LNC -0.1453 -0.5269 -0.6252* -0.4591 -0.1190 -0.7888** * and ** : significant correlations at 0.05 and 0.01 probability levels, respectively. ULNC: upper layer nitrogen content; LLNC: lower layer nitrogen content; △LNC: the difference between ULNC and LLNC. LSCP: spectral characteristics of leaf layers. NDVI: normalized difference vegetation index; PRI: pigment ratio index; PPR: plant pigment ratio; OSAVI: optical soil adjusted index; RVI: ratio of vegetation index. 3.5 Model Relating Grads of Spectral Parameter and Those of Nitrogen Content across Leaf Layers The following models were developed from the siginificant correlations between grads of spectral parameter and those of nitrogen content in leaf layers: Flowering stage of Jingdong8: △LNC (%) = 35.2842△RVI+0.3822 R2 =0.8267**, n=24 (1) Milking stage of Zhongyou9507: △LNC (%) = -8.0692△RVI+1.5506 R2 =0.8099**, n=24 (2) 3.6 Leaf Layer Spectral Model for Protein Content in Wheat Grains A prediction model for GPC based on spectra of leaf layers was developed as follows: a) Jingdong8 at the flowering stage: GPC (%) = 12.0168△RVI + 15.6975 R2 =0.7727**, n=24 (3)