正在加载图片...
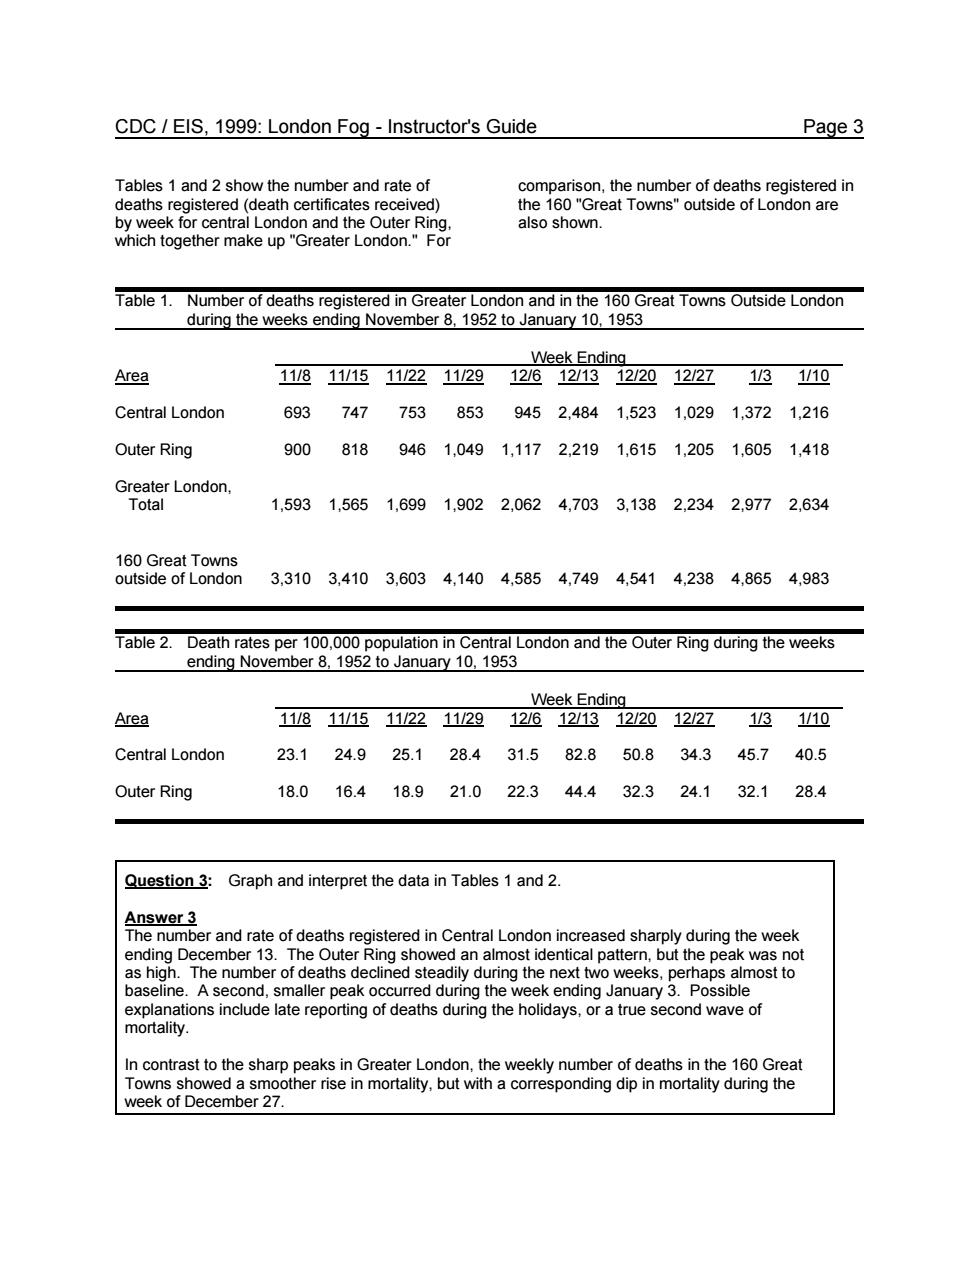
CDC/EIS,1999:London Fog-Instructor's Guide Page 3 Tables 1 and 2 show the number and rate of comparison,the number of deaths registered in deaths registered (received) the 160"Great Towns"outside of London are also shown Week Ending Area 118111151122112912612131220122713110 Central London 6937477538539452.4841.5231.0291.3721.216 Outer Ring 9008189461.0491,1172.2191,6151,2051,6051,418 Lnn 1,5931.5651.6991.9022.0624.7033,1382.2342.9772.634 ae8eatIasn 3,3103,4103,6034,1404,5854,7494,5414,2384,8654,983 Table 2.Deathr Nous per nuary Area 啦2逸2蓝”2亚返四 Central London 23.124.925.128.431.582.850.834.345.740.5 Outer Ring 18.016.418.921.022.344.432.324.132.128.4 Question 3:Graph and interpret the data in Tables 1 and 2. Answer 3 The number and rate of deaths registered in Central London increased sharply during the week baseline.Aseco d.sr maller peak occurred during the week ending January 3.Possible ations include late reporting of deaths during the holidays,or a true second wave of In contrast to the sharp peaks in Greater London.the weekly number of deaths in the 160 Great CDC / EIS, 1999: London Fog - Instructor's Guide Page 3 Tables 1 and 2 show the number and rate of deaths registered (death certificates received) by week for central London and the Outer Ring, which together make up "Greater London." For comparison, the number of deaths registered in the 160 "Great Towns" outside of London are also shown. Table 1. Number of deaths registered in Greater London and in the 160 Great Towns Outside London during the weeks ending November 8, 1952 to January 10, 1953 Week Ending Area 11/8 11/15 11/22 11/29 12/6 12/13 12/20 12/27 1/3 1/10 Central London 693 747 753 853 945 2,484 1,523 1,029 1,372 1,216 Outer Ring 900 818 946 1,049 1,117 2,219 1,615 1,205 1,605 1,418 Greater London, Total 1,593 1,565 1,699 1,902 2,062 4,703 3,138 2,234 2,977 2,634 160 Great Towns outside of London 3,310 3,410 3,603 4,140 4,585 4,749 4,541 4,238 4,865 4,983 Table 2. Death rates per 100,000 population in Central London and the Outer Ring during the weeks ending November 8, 1952 to January 10, 1953 Week Ending Area 11/8 11/15 11/22 11/29 12/6 12/13 12/20 12/27 1/3 1/10 Central London 23.1 24.9 25.1 28.4 31.5 82.8 50.8 34.3 45.7 40.5 Outer Ring 18.0 16.4 18.9 21.0 22.3 44.4 32.3 24.1 32.1 28.4 Question 3: Graph and interpret the data in Tables 1 and 2. Answer 3 The number and rate of deaths registered in Central London increased sharply during the week ending December 13. The Outer Ring showed an almost identical pattern, but the peak was not as high. The number of deaths declined steadily during the next two weeks, perhaps almost to baseline. A second, smaller peak occurred during the week ending January 3. Possible explanations include late reporting of deaths during the holidays, or a true second wave of mortality. In contrast to the sharp peaks in Greater London, the weekly number of deaths in the 160 Great Towns showed a smoother rise in mortality, but with a corresponding dip in mortality during the week of December 27