正在加载图片...

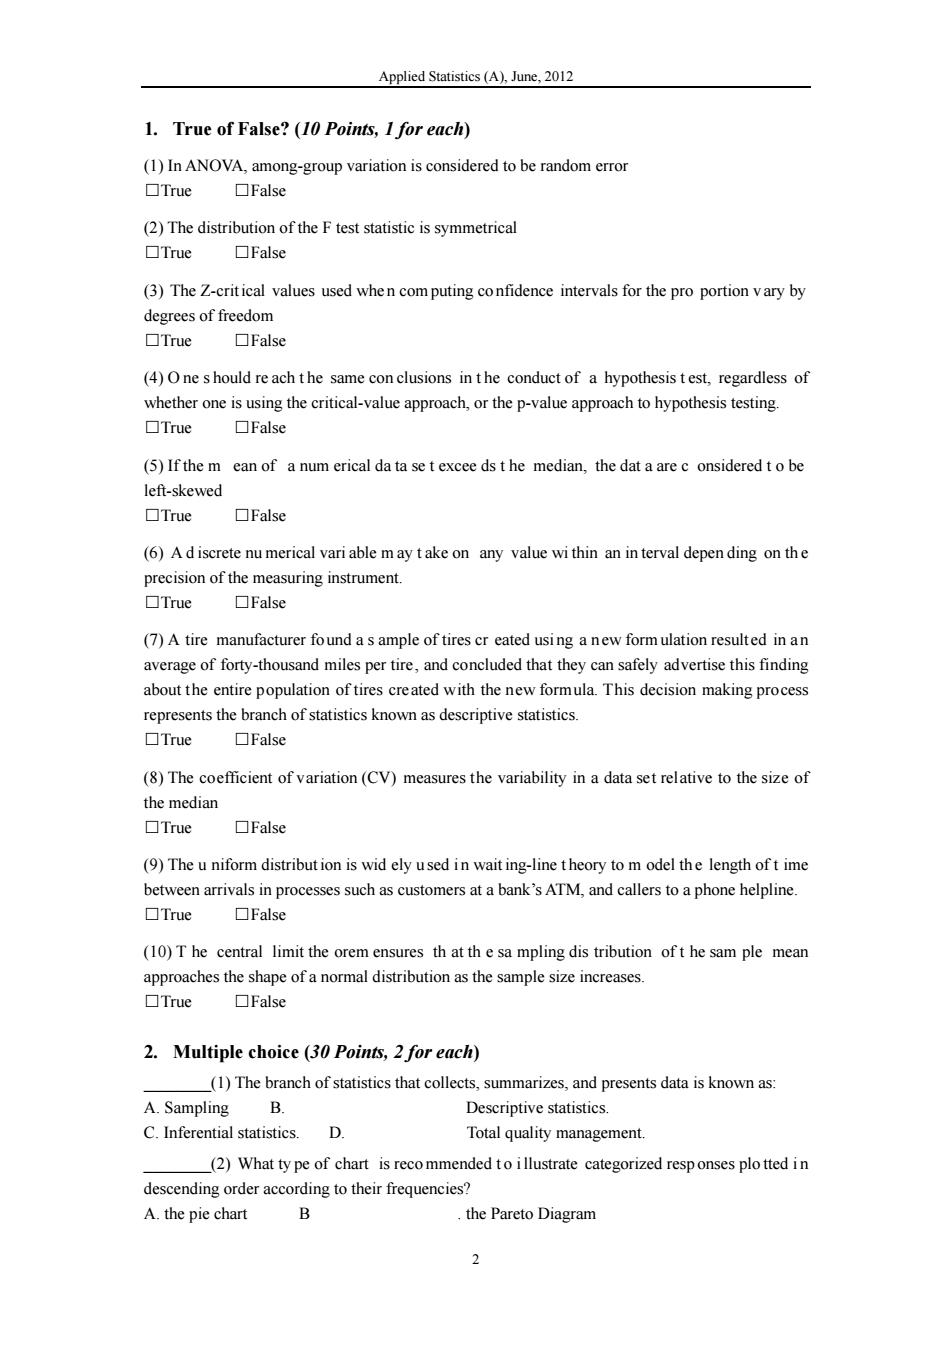
Applied Statistics(A).June.201 1.True of False?(10 Points,Ifor each) (1)nANOVAmn-rouvariatio is True ☐False (2)The distribution of the F test statistic is symmetrical OTrue False (3)values used when computing confidence intervals for the pro porion vary by degrees of freedon ☐True☐False (4)One should reachthe same conclusions in the conduct of a hypothesistest,regardless of whether one is using the critical-value approach,or the p-value approach to hypothesis testing. OTrue False (5)Ifthe m ean of a num erical datasetexcee dsthe median,the dat aaree onsideredtobe left-skewed ☐True☐False (6)variable may take any value within an interval depen dingonthe of the me asuring instrument True ■False (7)A tire manufacturer found as ample of tires cr eated using a new formulation resulted in an average of forty-thousand miles per tire,and concluded that they can safely advertise this finding represents the b True ☐False (8)The coefficient of variation(CV)measures the variability in a data set relative to the size of the median True False (9)Theuniform distribution is wid ely usedin wait ing-line theory tomodel the length oftime between arrivals in processes such as customers at a bank's ATM,and callers to a phone helpline. 口True口False (10)The central limit the orem ensures th at th esa mpling dis tribution oft he sam ple mean e ofa normal distribution as the ☐Fas 2.Multiple choice(30 Points,2 for each) (1)The branch of statistics that collects,summarizes,and presents data is known as: A.Sampling B. Descriptive statistics. C.Inferential statistics.D. Total quality management. (2)What type of chart is recommendedtoillustrate categorized responses plotted in descending order according to their frequencies? A.the pie chart B the Pareto DiagramApplied Statistics (A), June, 2012 2 1. True of False? (10 Points, 1 for each) (1) In ANOVA, among-group variation is considered to be random error □True □False (2) The distribution of the F test statistic is symmetrical □True □False (3) The Z-crit ical values used whe n com puting co nfidence intervals for the pro portion v ary by degrees of freedom □True □False (4) O ne s hould re ach t he same con clusions in t he conduct of a hypothesis t est, regardless of whether one is using the critical-value approach, or the p-value approach to hypothesis testing. □True □False (5) If the m ean of a num erical da ta se t excee ds t he median, the dat a are c onsidered t o be left-skewed □True □False (6) A d iscrete nu merical vari able m ay t ake on any value wi thin an in terval depen ding on th e precision of the measuring instrument. □True □False (7) A tire manufacturer fo und a s ample of tires cr eated usi ng a n ew formulation result ed in a n average of forty-thousand miles per tire, and concluded that they can safely advertise this finding about the entire population of tires created with the new formula. This decision making process represents the branch of statistics known as descriptive statistics. □True □False (8) The coefficient of variation (CV) measures the variability in a data set relative to the size of the median □True □False (9) The u niform distribut ion is wid ely u sed i n wait ing-line t heory to m odel th e length of t ime between arrivals in processes such as customers at a bank’s ATM, and callers to a phone helpline. □True □False (10) T he central limit the orem ensures th at th e sa mpling dis tribution of t he sam ple mean approaches the shape of a normal distribution as the sample size increases. □True □False 2. Multiple choice (30 Points, 2 for each) ________(1) The branch of statistics that collects, summarizes, and presents data is known as: A. Sampling B. Descriptive statistics. C. Inferential statistics. D. Total quality management. ________(2) What ty pe of chart is reco mmended t o i llustrate categorized resp onses plo tted i n descending order according to their frequencies? A. the pie chart B . the Pareto Diagram