正在加载图片...

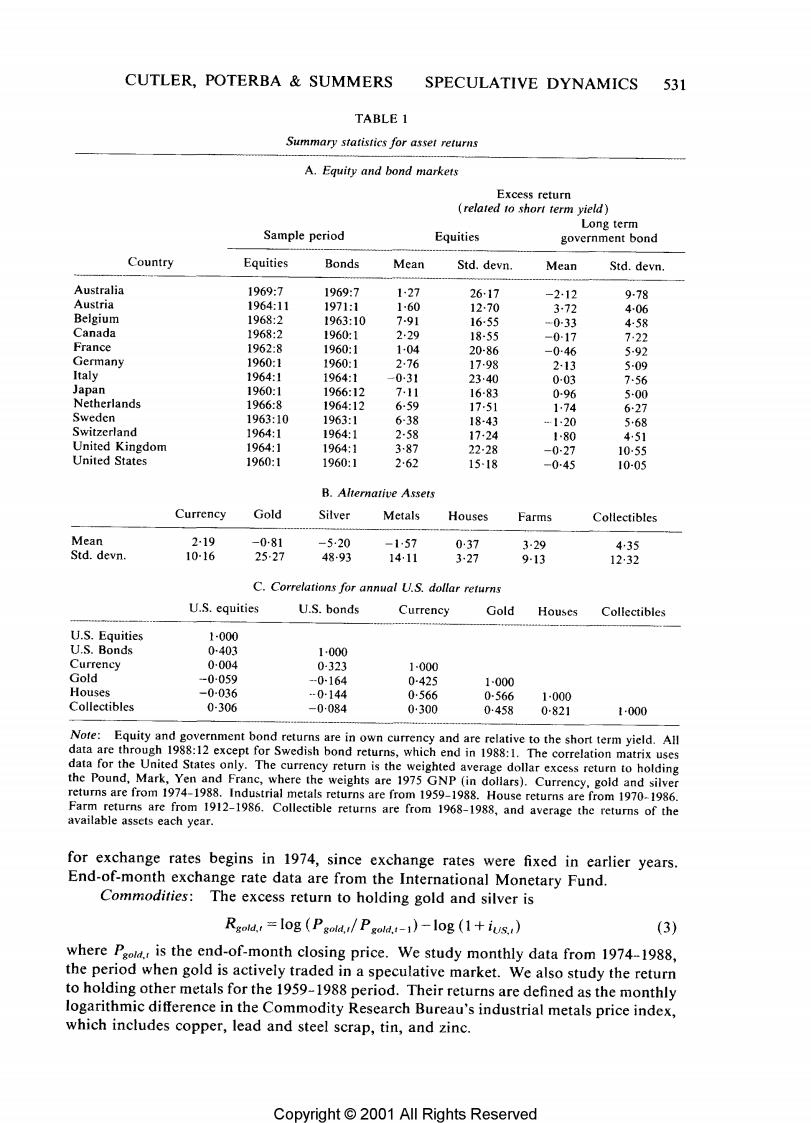
CUTLER,POTERBA SUMMERS SPECULATIVE DYNAMICS 531 TABLE 1 Summary statistics for asset returns A.Equity and bond markets Excess return related to short term yield) Long term Sample period Equities government bond Country Equities Bonds Mean Std.devn. Mean Std.devn. Australia 1969:7 1969:7 1-27 2617 -2.12 9-78 Austria 1964:11 1971:1 160 12.70 372 4-06 Belgium 1968:2 1963:10 791 16-55 -0-33 458 Canada 1968:2 1960:1 2·29 18-55 -017 722 France 1962:8 1960:1 1-04 20-86 -046 592 Germany 1960:1 1960:1 2.76 1798 213 5-09 Italy 1964:1 1964:1 -031 23.40 0-03 7.56 Japan 1960:1 1966:12 7,11 16-83 0-96 5-00 Netherlands 1966:8 1964:12 6-59 17-51 1.74 6·27 Sweden 1963:10 1963:1 6-38 18-43 1…20 568 Switzerland 1964:1 1964:1 2-58 17-24 1-80 451 United Kingdom 1964:1 1964:1 387 22-28 -0-27 1055 United States 1960:1 1960:1 262 15-18 -045 10-05 B.Alternative Assets Currency Gold Silver Metals Houses Farms Collectibles Mean 2-19 -081 -5·20 -157 037 3-29 435 Std.devn. 10-16 25-27 48-93 1411 327 9-13 12,32 C.Correlations for annual U.S.dollar returns U.S.equities U.S.bonds Currency Gold Houses Collectibles U.S.Equities 1-000 U.S.Bonds 0-403 1.000 Currency 0-004 0-323 1-000 Gold -0059 -0-164 0-425 1-000 Houses -0-036 -0-144 0566 0-566 1-000 Collectibles 0-306 -0084 0300 0:458 0-821 1-000 Note:Equity and government bond returns are in own currency and are relative to the short term yield.All data are through 1988:12 except for Swedish bond returns,which end in 1988:1.The correlation matrix uses data for the United States only.The currency return is the weighted average dollar excess return to holding the Pound,Mark,Yen and Franc,where the weights are 1975 GNP(in dollars).Currency,gold and silver returns are from 1974-1988.Industrial metals returns are from 1959-1988.House returns are from 1970-1986. Farm returns are from 1912-1986.Collectible returns are from 1968-1988,and average the returns of the available assets each year. for exchange rates begins in 1974,since exchange rates were fixed in earlier years. End-of-month exchange rate data are from the International Monetary Fund. Commodities:The excess return to holding gold and silver is Rgold.=log (Pgold./Pgold.-1)-log (1+ius.) (3) where Paold.,is the end-of-month closing price.We study monthly data from 1974-1988, the period when gold is actively traded in a speculative market.We also study the return to holding other metals for the 1959-1988 period.Their returns are defined as the monthly logarithmic difference in the Commodity Research Bureau's industrial metals price index, which includes copper,lead and steel scrap,tin,and zinc. Copyright 2001 All Rights Reserved