正在加载图片...

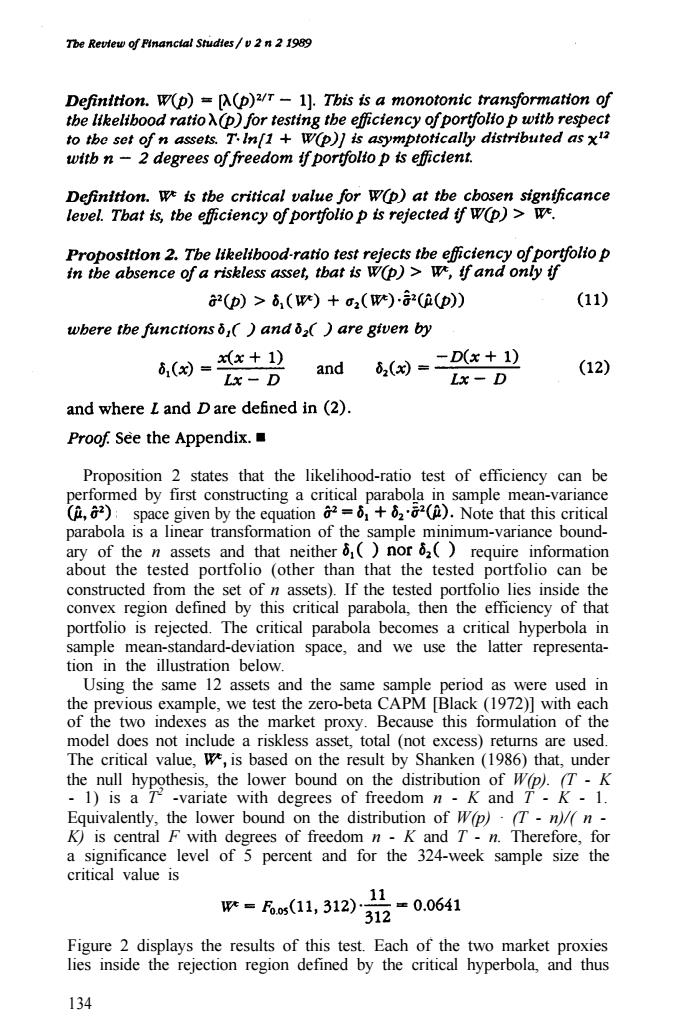
Tbe Revtew of Financtal Studtes/v 2 n 2 1989 Definition.W(p)=A(p)2/T-1).This is a monotonic transformation of the lkelibood ratio(p)for testing the efficiency of portfolto p witb respect to the set of n assets.T.In[1 W(p)]is asymptotically distributed as x12 witb n-2 degrees of freedom if portfolto p is effictent. Definition.we is tbe critical value for W(p)at tbe chosen significance level.Tbat is,the efficiency of portfolio p is rejected ff w(p)>W. Proposition 2.Tbe likelibood-ratio test rejects tbe effictency ofportfolto p in the absence of a riskless asset,that is w(p)>w,ff and only if 2(p)>i,()+2()·(a(D) (11) ubere the functionsδ,()andi,()are given by 6,(=x+) and 6,(=-Dx+1) (12) Lx-D Lx-D and where L and D are defined in(2). Proof.See the Appendix. Proposition 2 states that the likelihood-ratio test of efficiency can be performed by first constructing a critical parabola in sample mean-variance (2)space given by the equation2=+2).Note that this critical parabola is a linear transformation of the sample minimum-variance bound- ary of the n assets and that neither 6()nor 6()require information about the tested portfolio (other than that the tested portfolio can be constructed from the set of n assets).If the tested portfolio lies inside the convex region defined by this critical parabola,then the efficiency of that portfolio is rejected.The critical parabola becomes a critical hyperbola in sample mean-standard-deviation space,and we use the latter representa- tion in the illustration below. Using the same 12 assets and the same sample period as were used in the previous example,we test the zero-beta CAPM [Black(1972)]with each of the two indexes as the market proxy.Because this formulation of the model does not include a riskless asset,total (not excess)returns are used. The critical value,we,is based on the result by Shanken (1986)that,under the null hypothesis,the lower bound on the distribution of W(p).(T-K -1)is a T-variate with degrees of freedom n-K and T-K-1. Equivalently,the lower bound on the distribution of W(p)(T-n)/n K)is central F with degrees of freedom n-K and T-n.Therefore,for a significance level of 5 percent and for the 324-week sample size the critical value is =1,312)0=0.0641 312 Figure 2 displays the results of this test.Each of the two market proxies lies inside the rejection region defined by the critical hyperbola,and thus 134Proposition 2 states that the likelihood-ratio test of efficiency can be performed by first constructing a critical parabola in sample mean-variance space given by the equation Note that this critical parabola is a linear transformation of the sample minimum-variance boundary of the n assets and that neither require information about the tested portfolio (other than that the tested portfolio can be constructed from the set of n assets). If the tested portfolio lies inside the convex region defined by this critical parabola, then the efficiency of that portfolio is rejected. The critical parabola becomes a critical hyperbola in sample mean-standard-deviation space, and we use the latter representation in the illustration below. Using the same 12 assets and the same sample period as were used in the previous example, we test the zero-beta CAPM [Black (1972)] with each of the two indexes as the market proxy. Because this formulation of the model does not include a riskless asset, total (not excess) returns are used. The critical value, is based on the result by Shanken (1986) that, under the null hypothesis, the lower bound on the distribution of W(p). (T - K - 1) is a T 2 -variate with degrees of freedom n - K and T - K - 1. Equivalently, the lower bound on the distribution of W(p) · (T - n)/( n - K) is central F with degrees of freedom n - K and T - n. Therefore, for a significance level of 5 percent and for the 324-week sample size the critical value is Figure 2 displays the results of this test. Each of the two market proxies lies inside the rejection region defined by the critical hyperbola, and thus 134