正在加载图片...

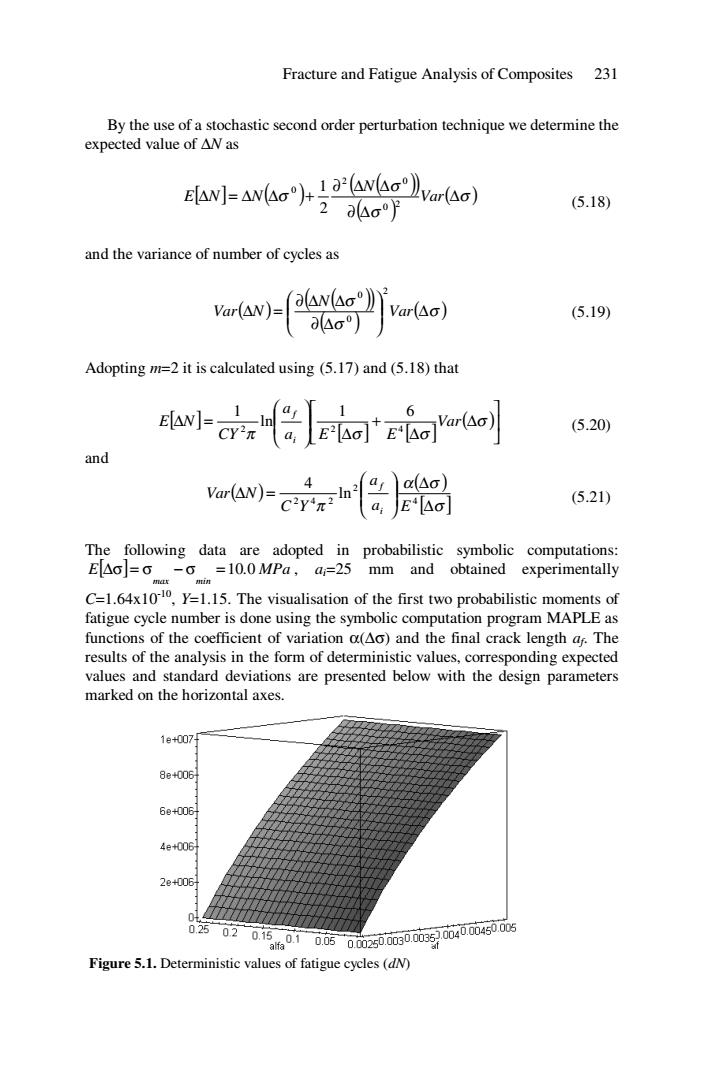
Fracture and Fatigue Analysis of Composites 231 By the use of a stochastic second order perturbation technique we determine the expected value of△Was Eilw]=Awho+;a。arao) 204σ月 (5.18) and the variance of number of cycles as w)- Var(Ao) (5.19) Adopting m=2 it is calculated using(5.17)and(5.18)that gatraaloa (5.20) and a:E△o】 (5.21) The following data are adopted in probabilistic symbolic computations: EAo]=6 -6 =10.0 MPa,a;=25 mm and obtained experimentally C=1.64x10¹⁰,Y=1.15.The visualisation of the first two probabilistic moments of fatigue cycle number is done using the symbolic computation program MAPLE as functions of the coefficient of variation a(Ao)and the final crack length as.The results of the analysis in the form of deterministic values,corresponding expected values and standard deviations are presented below with the design parameters marked on the horizontal axes. 1e+007 8e+006 6e+006 4e+006 2e+006 02502d1501050i250500ias20i4000450.0 Figure 5.1.Deterministic values of fatigue cycles (dN)Fracture and Fatigue Analysis of Composites 231 By the use of a stochastic second order perturbation technique we determine the expected value of ∆N as [ ] ( ) ( ) ( ) ( ) ( ) σ σ σ σ ∆ ∂ ∆ ∂ ∆ ∆ ∆ = ∆ ∆ + Var N E N N 2 0 2 0 0 2 1 (5.18) and the variance of number of cycles as ( ) ( ) ( ) ( ) ( ) σ σ σ ∆ ⎟ ⎟ ⎠ ⎞ ⎜ ⎜ ⎝ ⎛ ∂ ∆ ∂ ∆ ∆ ∆ = Var N Var N 2 0 0 (5.19) Adopting m=2 it is calculated using (5.17) and (5.18) that [ ] [ ] [ ] ( )⎥ ⎦ ⎤ ⎢ ⎣ ⎡ ∆ ∆ + ∆ ⎟ ⎟ ⎠ ⎞ ⎜ ⎜ ⎝ ⎛ ∆ = σ π σ σ Var a E E a CY E N i f 2 2 4 1 6 ln 1 (5.20) and ( ) ( ) [ ] σ α σ π ∆ ∆ ⎟ ⎟ ⎠ ⎞ ⎜ ⎜ ⎝ ⎛ ∆ = 4 2 2 4 2 ln 4 a E a C Y Var N i f (5.21) The following data are adopted in probabilistic symbolic computations: E[ ] . MPa max min ∆σ = σ − σ = 10 0 , ai=25 mm and obtained experimentally C=1.64x10⁻¹⁰, Y=1.15. The visualisation of the first two probabilistic moments of fatigue cycle number is done using the symbolic computation program MAPLE as functions of the coefficient of variation α(∆σ) and the final crack length af. The results of the analysis in the form of deterministic values, corresponding expected values and standard deviations are presented below with the design parameters marked on the horizontal axes. Figure 5.1. Deterministic values of fatigue cycles (dN)