正在加载图片...

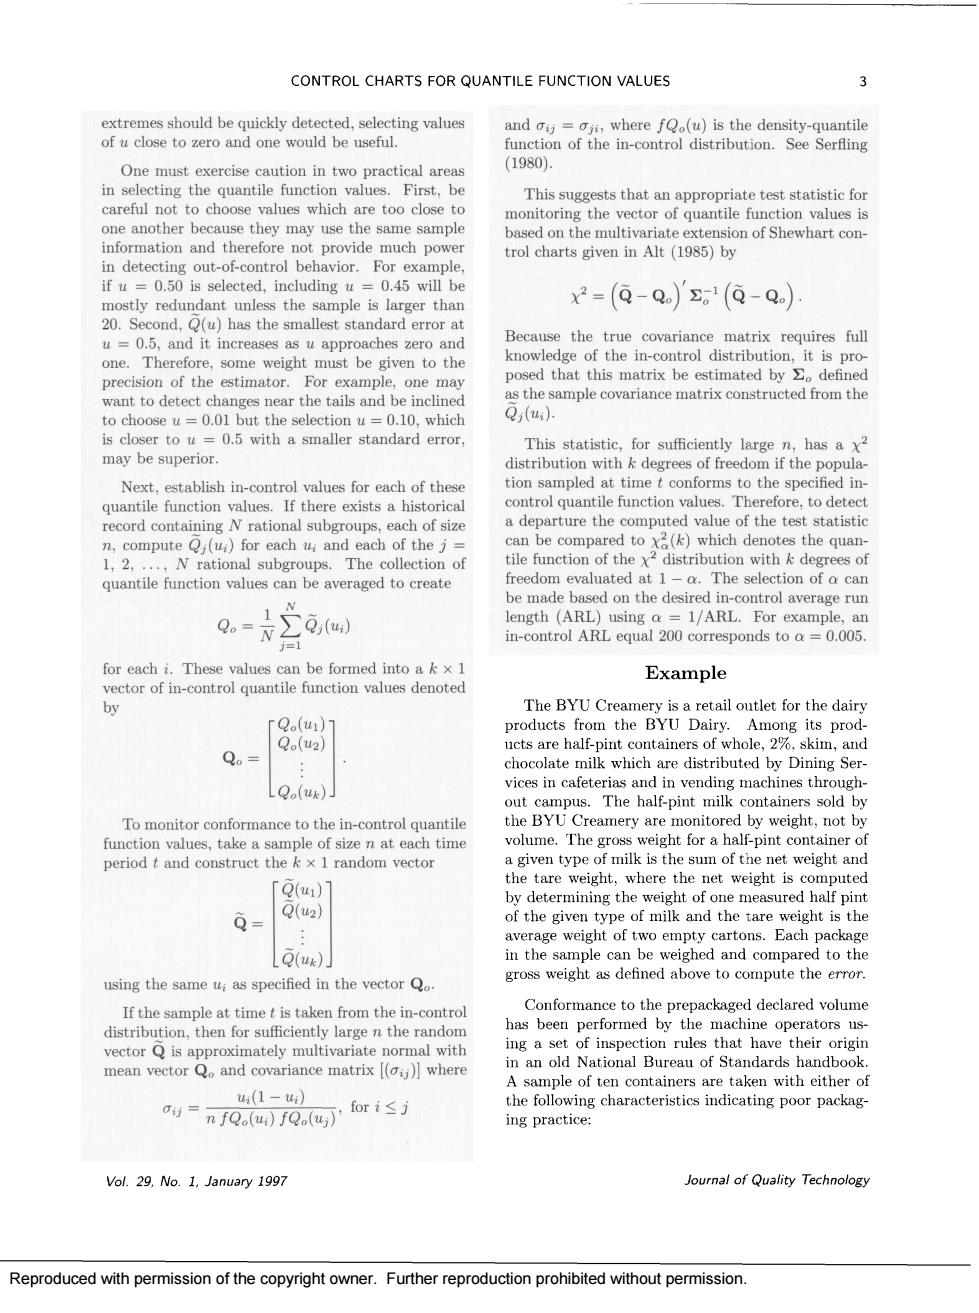
CONTROL CHARTS FOR QUANTILE FUNCTION VALUES extremes should be quickly detected,selecting values and ga=where fo (u)is the density-quantile of u close to zero and one would be useful. function of the in-control distribution.See Serfing One must exercise caution in two practical a 1980) in selecting the quantile function values.First,be This stic fo careful not to choose values which are too close fu b x2=(-Q)'1(-Q 20.Second,(u)has the smallest standard error at u -0.5,and it increases as u approaches zero and Because the true covariance matrix requires full knowledge of the in-control distribution ven to of the mated by 0,(u may be superior. of fre Therefore,to detec record containing y rational suberoups. each of size adeparture the computed he te compute (u)for each u and each of the j= hi freedom evaluted at 1-a.The selection of ca e mad ARL the desi control average ru in-control ARL equal 200 corresponds to =0.005. or for each i.These values can be formed into a k x I Example The bYu Cre a retail outlet for the dair 8.8 Among its prod- Q。= 02% skim,and oeonteafe LQo(u)] rias and in vendins ontainers sold by To monitor conformance to the in-control quantile mery are The weight.not女 Q(41) the tare w eight,where the net weight is Q(u2 of milk and the LQ(ME)] intheean ecartons.Each using the same as specified in the vectorQ Conformance to the pre ackaged declared volume has been performed by the r nachine operators ns have thei mean vectorQ。and covariance matrix【(oy】where A sample of ten containers are taken with either of the follo Vol.29.No.1.January 1997 Joural of Quality Technology Reproduced with permission of the copyright owner.Further reproduction prohibited without permission.Reproduced with permission of the copyright owner. Further reproduction prohibited without permission