正在加载图片...

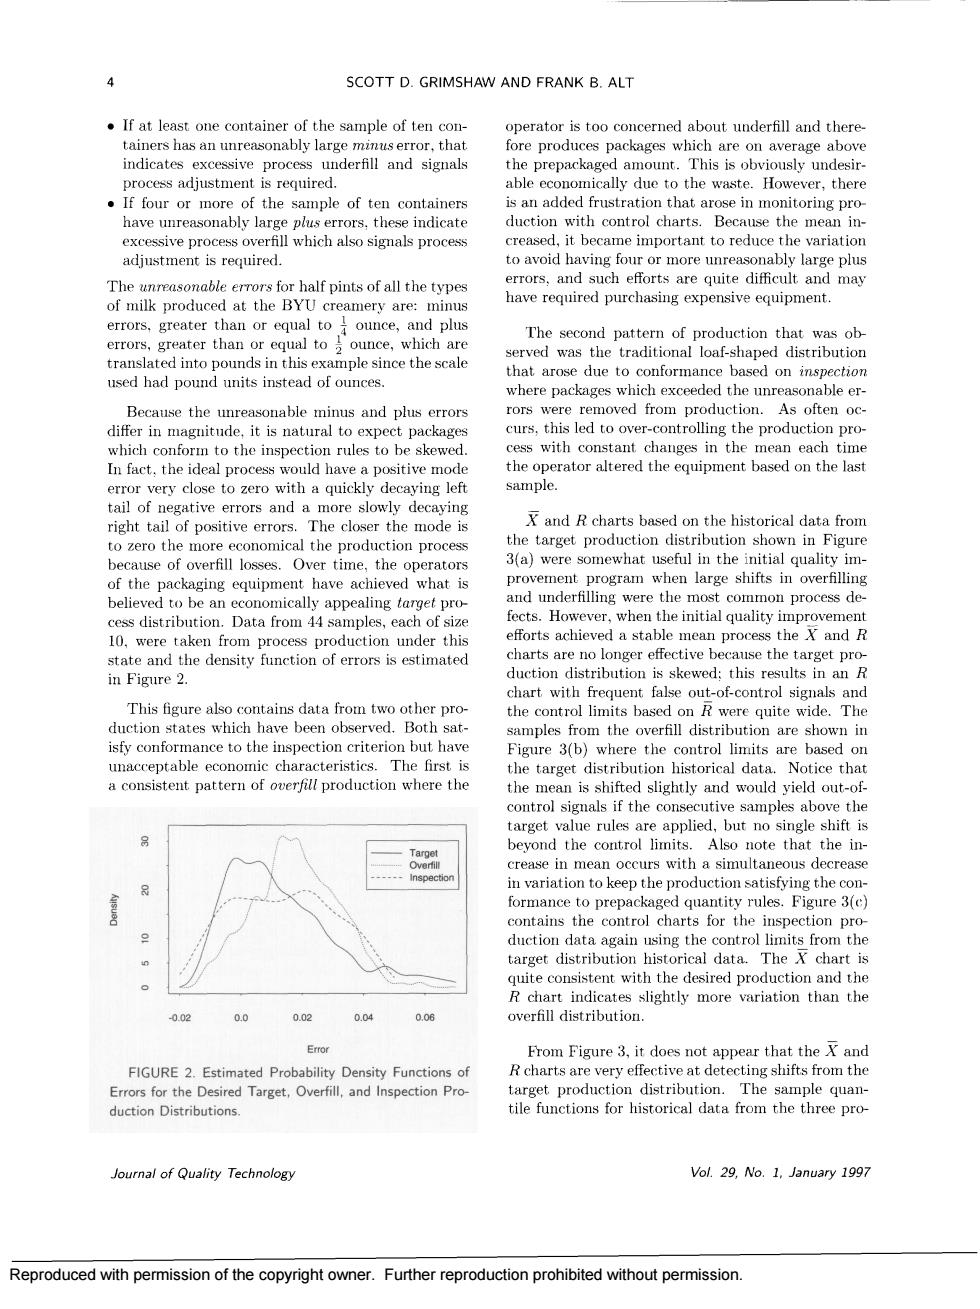
4 SCOTT D.GRIMSHAW AND FRANK B ALT .If at least one container of the sample of ten con- operator is too concerned about underfill and there ve proces the prepackaged amon .If four or more of the sample of ten containers isan added frustration that arose in monitoring pro duction with control charts.Because the mean in errors,and such efforts are quite difficult and may ave required purchasing expensive equipment. errors,greater than or equal toounce,and plus The second pattern of production that was ob due to confo where packages which exceeded the rors hi led from produc on. As oft en oc nale it is natural cess with constant changes in the mean each time and Rchart on the historical data to zero the more economical the production proces h time,the operators weroewauwehdinhenitialauai时y provement program when large shifts in overfilling und st common process de cess distribution.Data from 44 samples,each of size efforts achieved a stable mean process theand charts are no longer effective because the target pro in Figure 2. chart with frequent and This figure also R were quite wide.The isfy conformance to the inspection criterion but have on are shown in The the target distributio rical data.Notice tha the mean is shifted slightly and woul yield out- target value rules are applied.but no single shifti bevond the control limit Also note that the in formance to prepackaged quantity rules.Figure 3() contains the control charts for the pection pro quite consistent with the desired production and the R c 00 002 ao target production distribution.The sample quan duction Distributions. tile functions for historical data from the three pro oumal of Quality Technology Vol.29.No.1.January 1997 Reproduced with permission of the copyright owner.Further reproduction prohibited without permission. Reproduced with permission of the copyright owner. Further reproduction prohibited without permission