正在加载图片...

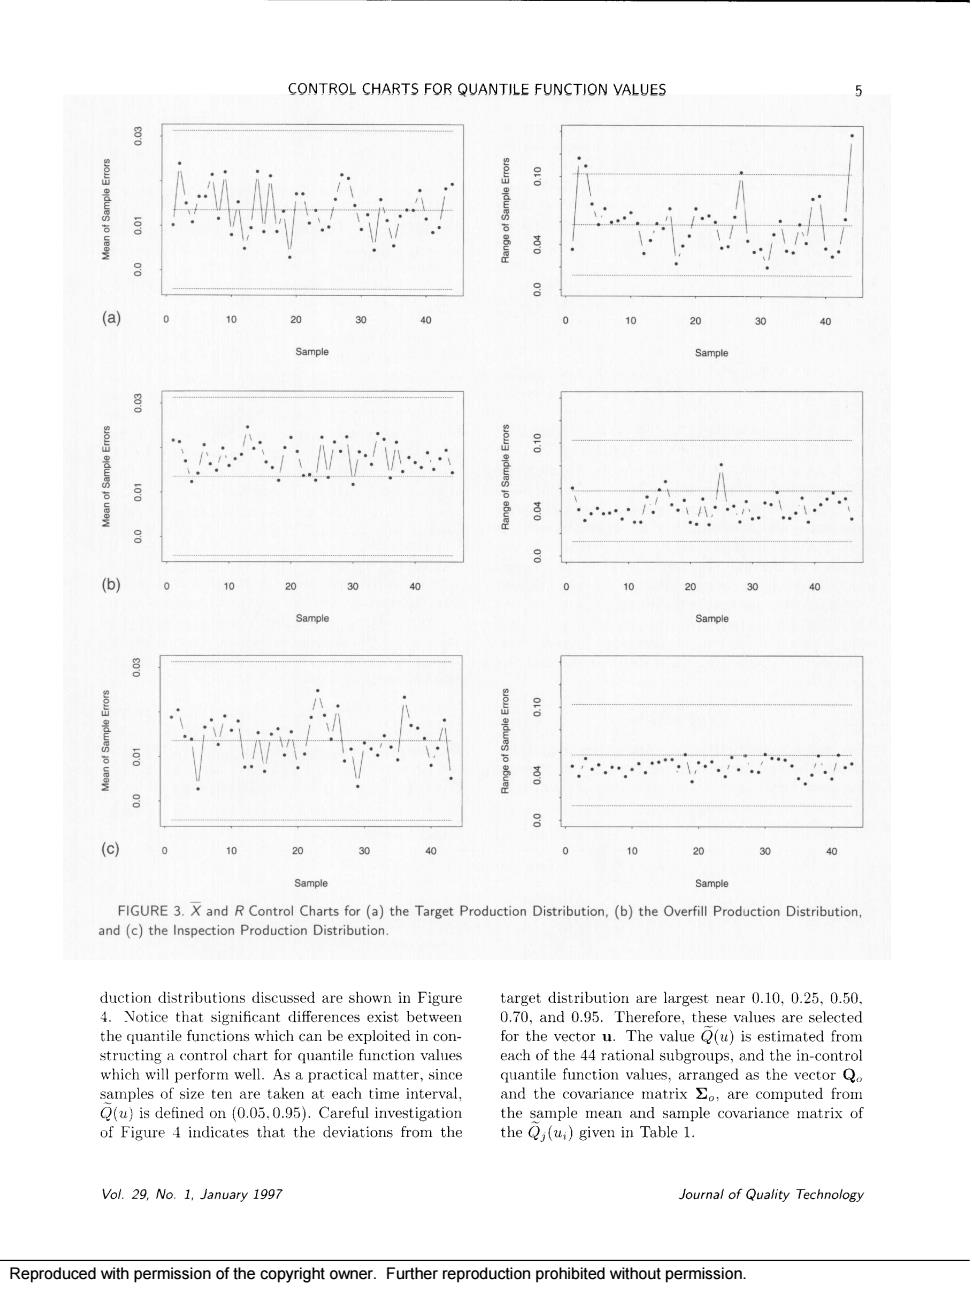
CONTROL CHARTS FOR QUANTILE FUNCTION VALUES ⊙ 20 30 Sample 20 30 40 20 30 c 0 20 30 0 0 0 20 30 40 FIGURE 3.X and RControl Charts for(a)the Target Production Distribution,(b)the Overfill Production Distribution. and (c)the Inspection Production Distribution duction distributions diseussed are shown in Figure target distribution are largest near 0.10.0.25.0.50 Notice t erences exis st between and 0.95 alue structing control chart for quntile function values each of the44 rational subgroups,and the in-control which will perform well.As a practical matter,since quantile function values,arranged as the vectorQ of Figure 4 indicates that the deviations from the and pe mean and sample covariance matrisof Vol.29,No.1.January 199 Journal of Quality Technology Reproduced with permission of the copyright owner.Further reproduction prohibited without permission.Reproduced with permission of the copyright owner. Further reproduction prohibited without permission