正在加载图片...

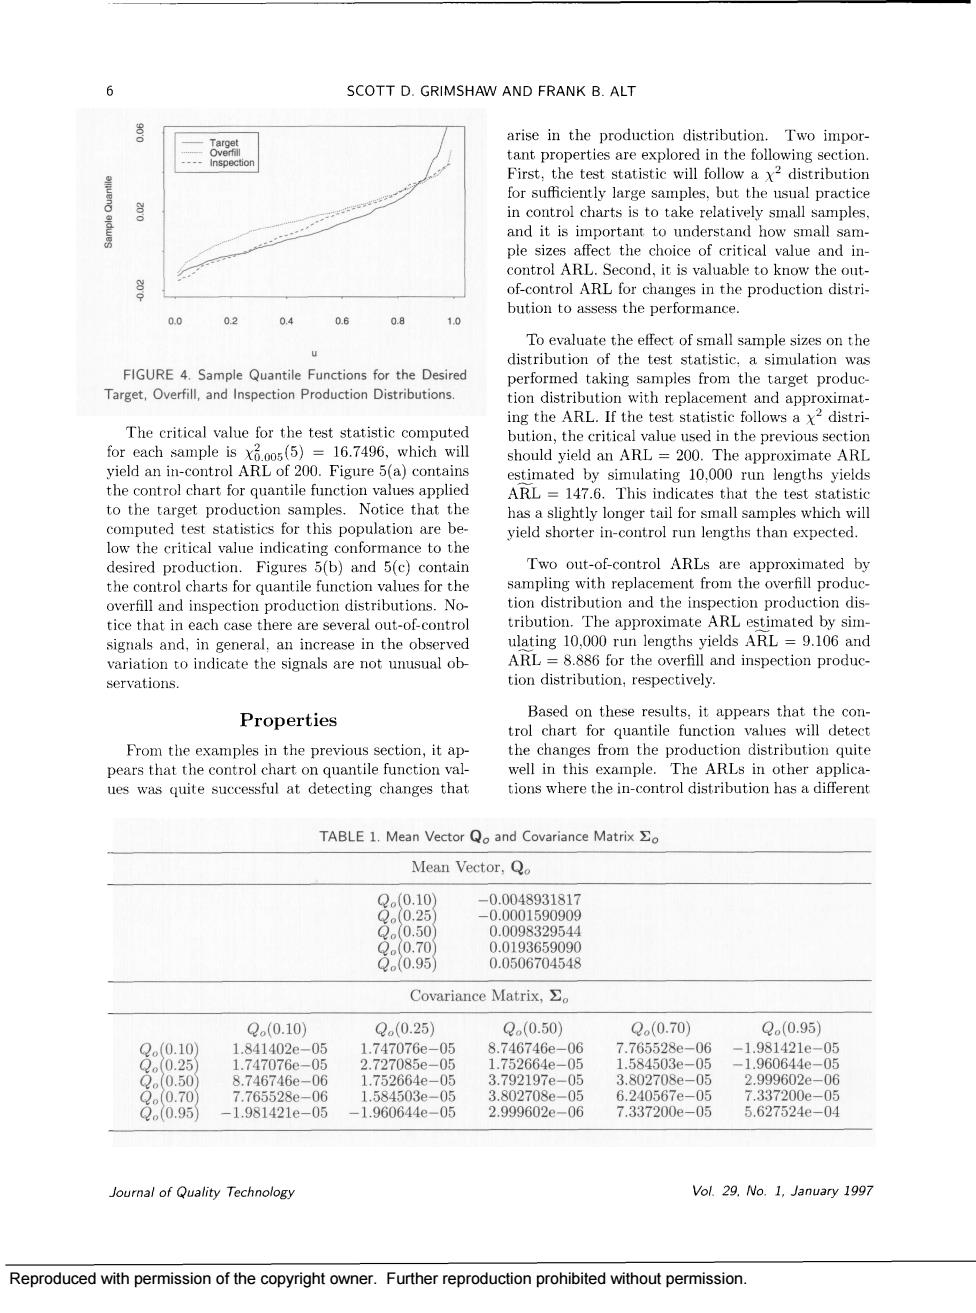
6 SCOTT D.GRIMSHAW AND FRANK B.ALT arise in the production distribution.Two impor- but the usual practice in control charts is to take relatively small samples d ir 0.0 04 performed taking samples from the target produc. ondetRiorw aCodanpPne The critical bution,the critical value used in the previous sectior trol ARL of 200.Fi ure 5(a)contains should yield an AR =200 The approximate A the control chart for quantile function values applied ARL =1476 This the to the target has a slightly longer tail for small samples which wil conformance to the yield shorter in-control run lengths than expected tion distribution and the inspe tice that in each case there are several out-of-control tribution sim ection tion distribution,respectively. Properties From the ev ples in the previous the。chart plica ues was quite successful at detecting changes that TABLE 1.Mean Vector Qo and Covariance Matrix o Mean Vector,Q 8 88 Covariance Matrix,。 0.0.101 0.10.251 00.50 0(0.70 00.95 41402e-05 17 -05 .746746e-0 .76552 -06 -1.981421e-05 80095 -1.981421e-05 -1.960644e-05 2.999602e-06 7.337200e-05 5.627524e-04 Journal of Quality Technology Vol.29.No.1,January 1997 Reproduced with permission of the copyright owner.Further reproduction prohibited without permission. Reproduced with permission of the copyright owner. Further reproduction prohibited without permission