正在加载图片...

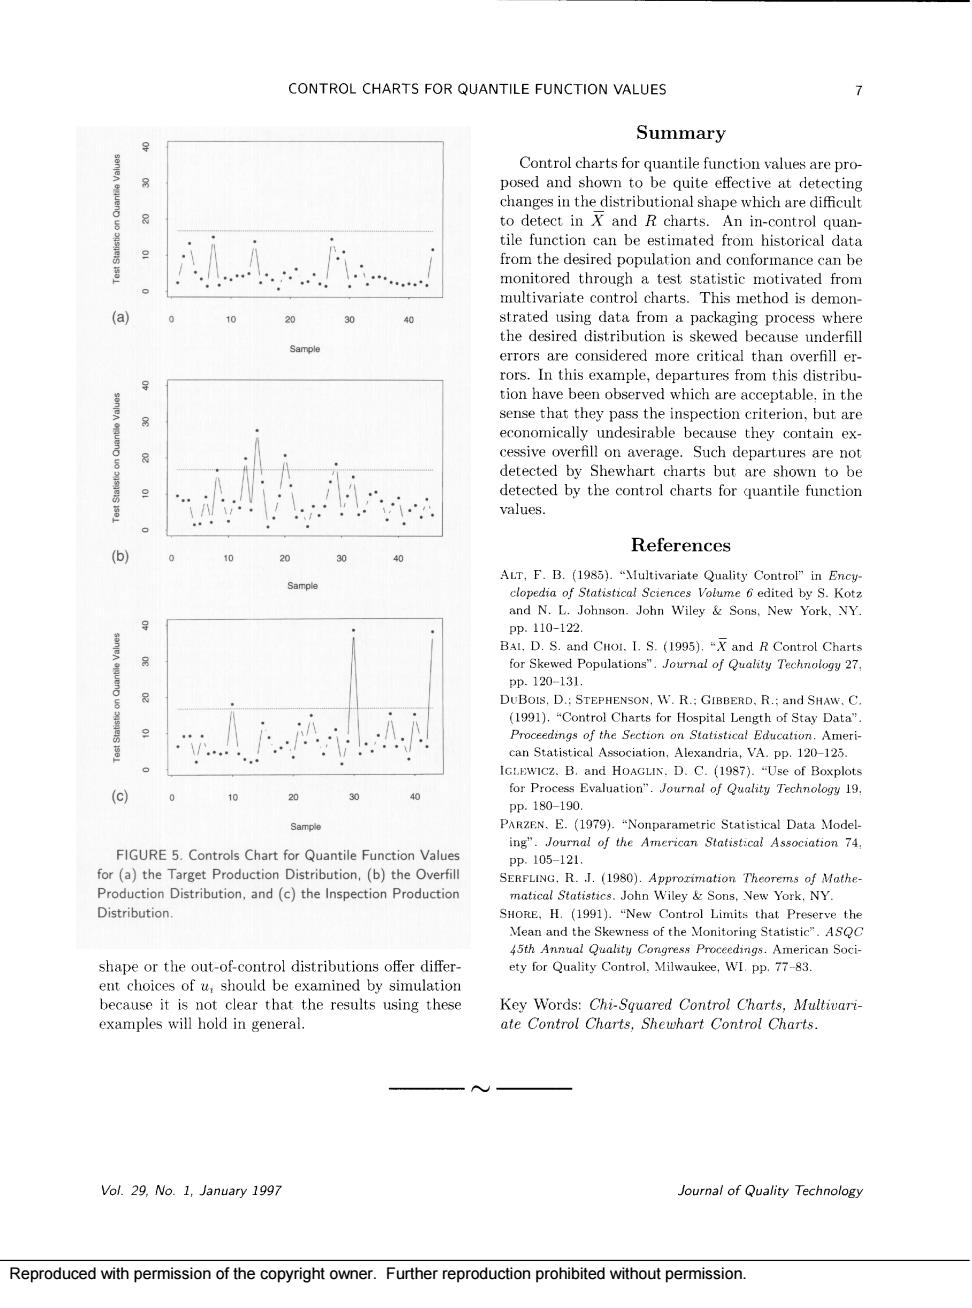
CONTROL CHARTS FOR QUANTILE FUNCTION VALUES Summary Control charts for quantile function values are pro cting to detect in and R charts.An in-control quan tile function can be estimated from historical data multivariate contro charts.This method is demon use u -6I errors are e critical tha rors.In this example.departures from this distribu- ion haveb which are acceptable.in the economically undesirable because they contain ex cessive overfill on average.Such departures are not values. 40 References ALT,F.B.(198. DUBoIs,D.:STEPHENSON,W.R.:.R.:and SHAW.C ria,VA.pp.120-125 (c) 0 10 20 30 40 ng". FIGURE 5.Controls Chart for Quantile Function Values ay for (a)the Target Production Distribution,(b)the Overfill SERFLING.R.1.(19)-Appr rimation Theorems of Mathe s.John Wiley So New York.NY shape or the out-of-control distributions offer differ. ent choices of u,should be examined by simulation Chi-So Vol.9,No.1.January 1997 Joural of Quality Technology Reproduced with permission of the copyright owner.Further reproduction prohibited without permission.Reproduced with permission of the copyright owner. Further reproduction prohibited without permission