正在加载图片...
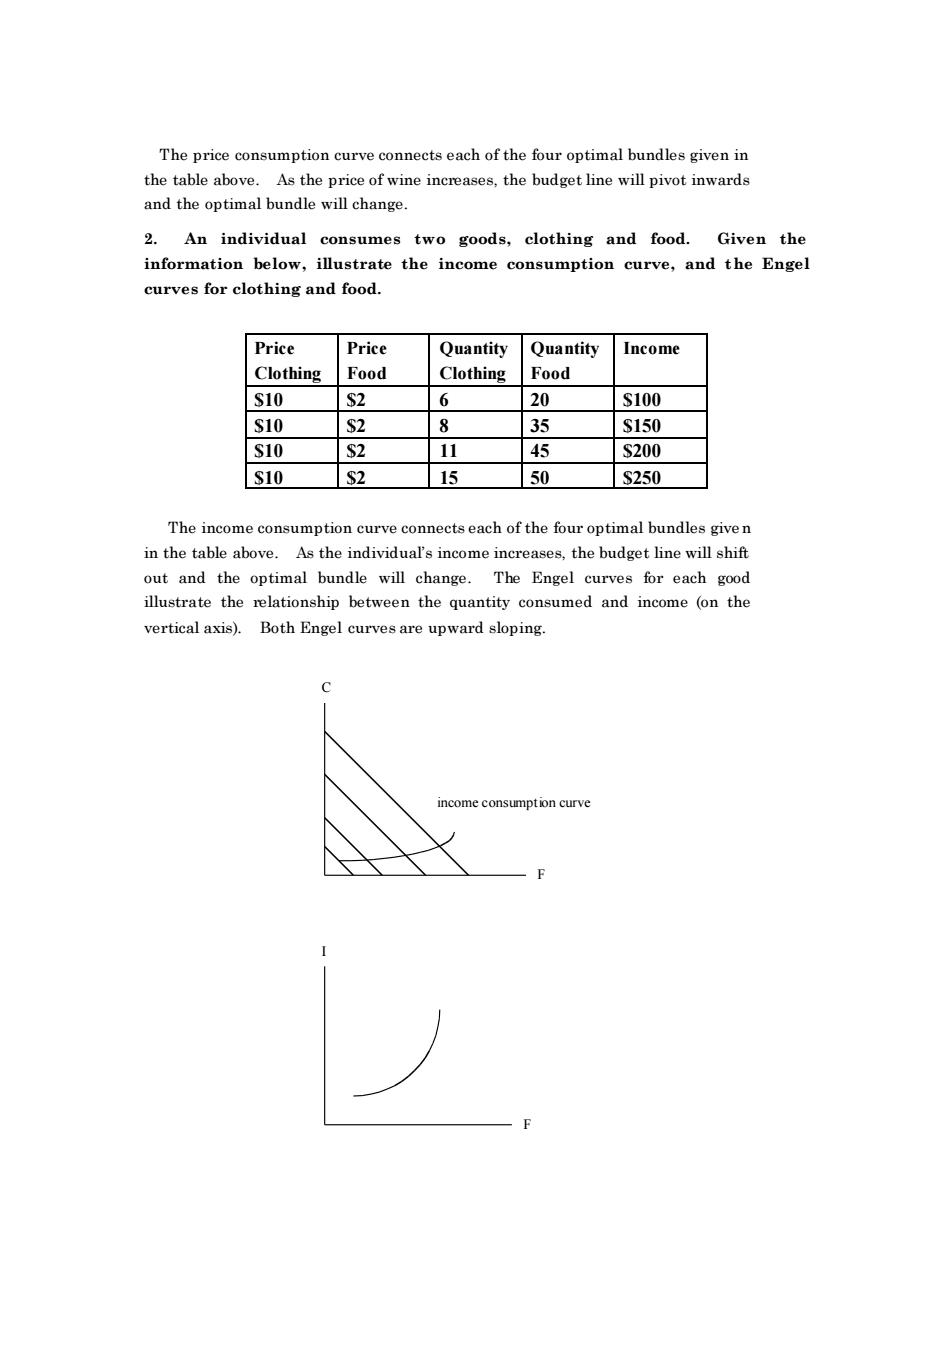
The price consumption curve of the four optimal bundles given i the table above. As the price of wine increases,the budget line will pivot inward and the optimal bundle will change. 2.An individual consumes two goods,clothing and food.Given the information below,illustrate the income consumption curve,and the Engel curves for clothing and food. Price Price Quantity Quantity Income Clothing Food Clothing Food S10 S2 6 20 S100 S10 R 35 S150 S70 11 S200 S10 S2 15 50 S250 The income consumption curve connects each of the four optimal bundles give n in the table above. As the individual's income incre ases the budget line will shift out and the bundle will hange. The Engel curv for each goo illustrate the relationship between the quantity consumed and income (on the vertical axis).Both Engel curves are upward sloping. income consumption curveThe price consumption curve connects each of the four optimal bundles given in the table above. As the price of wine increases, the budget line will pivot inwards and the optimal bundle will change. 2. An individual consumes two goods, clothing and food. Given the information below, illustrate the income consumption curve, and the Engel curves for clothing and food. Price Clothing Price Food Quantity Clothing Quantity Food Income $10 $2 6 20 $100 $10 $2 8 35 $150 $10 $2 11 45 $200 $10 $2 15 50 $250 The income consumption curve connects each of the four optimal bundles given in the table above. As the individual’s income increases, the budget line will shift out and the optimal bundle will change. The Engel curves for each good illustrate the relationship between the quantity consumed and income (on the vertical axis). Both Engel curves are upward sloping. C F income cons umpt ion curve I F