正在加载图片...
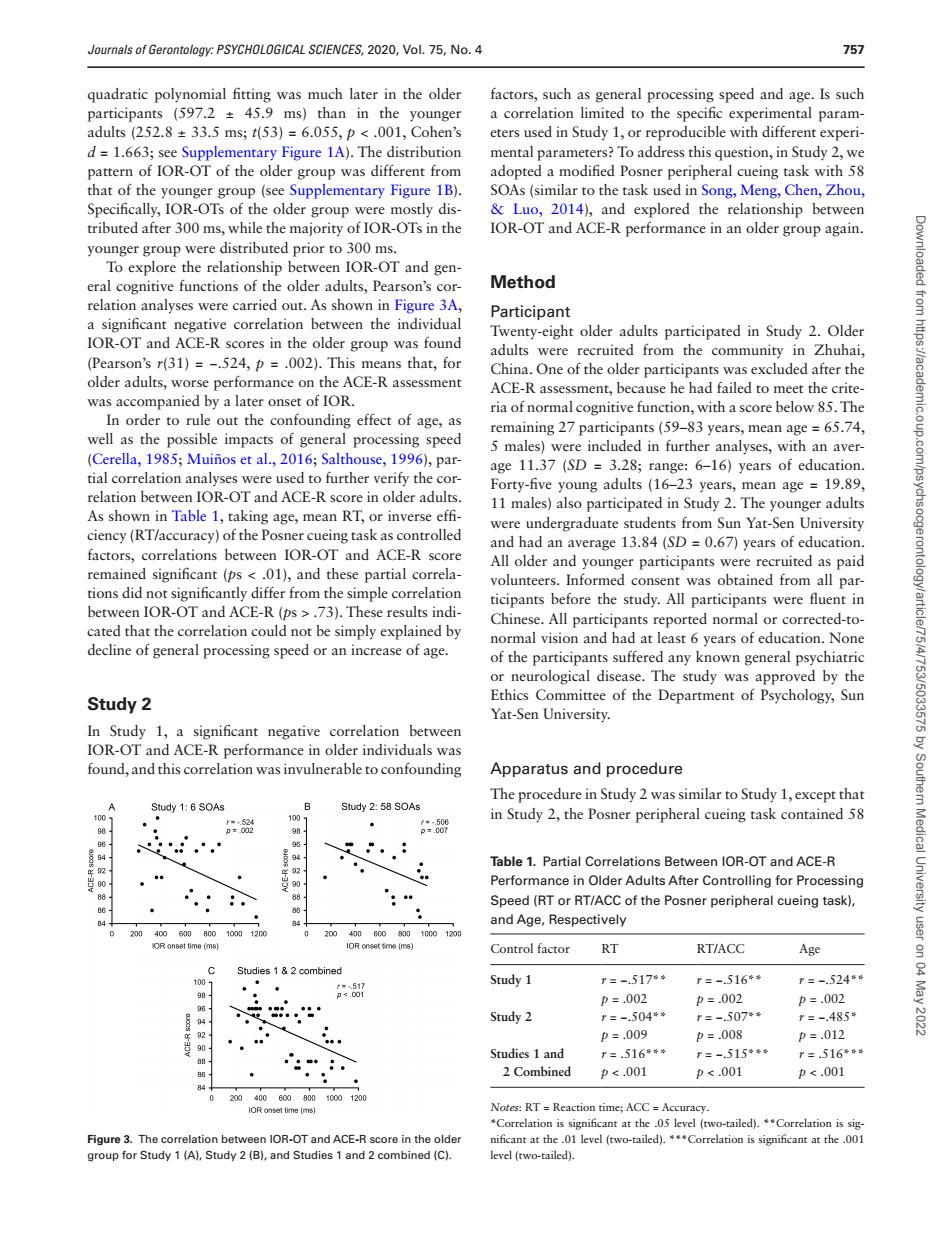
Journals of Gerontology:PSYCHOLOGICAL SCIENCES,2020,Vol.75,No.4 757 quadratic polynomial fitting was much later in the older factors,such as general processing speed and age.Is such 359 ms) ms;(53) eters use ,or reprod nnemof1oROofiheoa adopted a modifed os task with 58 that of the younger group (sSupplementary Figure 1B) OIs in th younger lation IOR-OT and gen eral cognitive functions of the older adults,Pearson's cor Method relation analyses were carried out As shown in Figure 3A corr the ParicipantoderadhlspanidipaiedinsSndy2,olde adults were recruited from the community in Zhuhai 311 524.=0021.Th s that.for older adults,worse performance on the ACE-R assessment smen use he ha led to 85 Th ut the ning 27 p s5993 :Salth 19g 5 males)were included in further analyses,with an aver tial correlation analyses were used to further verify the cor age 11.37 (SD=3.28;range:6-16)years of education rty-hve young adults (16-2 an age 19. 11 gage mean R and had an average 13.84 (SD =0.67)vears of cducation 6 IOR OT ACE R remained significant (s)and these partial correla- All older and younger participants were recruited as paid ed was obtai ed fron all par tions did not significantly differ from the simple correlation ween IOR-OT nd ACE-R 73).These re Chin had at least 6years of education.Non of the participants suffered any k nown general psychiatri The study was by the Study2 In Study 1,a significant negative correlation between ACE-R performance in old r individuals was ion was invulnerable to confounding Apparatus and procedure The procedure in Study 2 was similar to Study 1,except that Study 1:6 SOAs Study 2 58 SOAS in Study 2,the Posner peripheral cueing task contained 58 Table 1.Partial Correlations Between IOR-OT and ACE-R Performance in Older Adults After Controlling for Processing Speed (RT or RT/ACC of the Posner peripheral cueing task). ti and Age,Respectively Contro factor RT RTIACC Age Study 1 ,三-517* =-516 ,=-524* p=.002 p=.002 p=.002 M酒 Study 2 4 516 516 2 Combined p<.001 p<.001 pc.001 OR-OT and ACE-R in thquadratic polynomial fitting was much later in the older participants (597.2 ± 45.9 ms) than in the younger adults (252.8 ± 33.5 ms; t(53) = 6.055, p < .001, Cohen’s d = 1.663; see Supplementary Figure 1A). The distribution pattern of IOR-OT of the older group was different from that of the younger group (see Supplementary Figure 1B). Specifically, IOR-OTs of the older group were mostly distributed after 300 ms, while the majority of IOR-OTs in the younger group were distributed prior to 300 ms. To explore the relationship between IOR-OT and general cognitive functions of the older adults, Pearson’s correlation analyses were carried out. As shown in Figure 3A, a significant negative correlation between the individual IOR-OT and ACE-R scores in the older group was found (Pearson’s r(31) = −.524, p = .002). This means that, for older adults, worse performance on the ACE-R assessment was accompanied by a later onset of IOR. In order to rule out the confounding effect of age, as well as the possible impacts of general processing speed (Cerella, 1985; Muiños et al., 2016; Salthouse, 1996), partial correlation analyses were used to further verify the correlation between IOR-OT and ACE-R score in older adults. As shown in Table 1, taking age, mean RT, or inverse efficiency (RT/accuracy) of the Posner cueing task as controlled factors, correlations between IOR-OT and ACE-R score remained significant (ps < .01), and these partial correlations did not significantly differ from the simple correlation between IOR-OT and ACE-R (ps > .73). These results indicated that the correlation could not be simply explained by decline of general processing speed or an increase of age. Study 2 In Study 1, a significant negative correlation between IOR-OT and ACE-R performance in older individuals was found, and this correlation was invulnerable to confounding factors, such as general processing speed and age. Is such a correlation limited to the specific experimental parameters used in Study 1, or reproducible with different experimental parameters? To address this question, in Study 2, we adopted a modified Posner peripheral cueing task with 58 SOAs (similar to the task used in Song, Meng, Chen, Zhou, & Luo, 2014), and explored the relationship between IOR-OT and ACE-R performance in an older group again. Method Participant Twenty-eight older adults participated in Study 2. Older adults were recruited from the community in Zhuhai, China. One of the older participants was excluded after the ACE-R assessment, because he had failed to meet the criteria of normal cognitive function, with a score below 85. The remaining 27 participants (59–83 years, mean age = 65.74, 5 males) were included in further analyses, with an average 11.37 (SD = 3.28; range: 6–16) years of education. Forty-five young adults (16–23 years, mean age = 19.89, 11 males) also participated in Study 2. The younger adults were undergraduate students from Sun Yat-Sen University and had an average 13.84 (SD = 0.67) years of education. All older and younger participants were recruited as paid volunteers. Informed consent was obtained from all participants before the study. All participants were fluent in Chinese. All participants reported normal or corrected-tonormal vision and had at least 6 years of education. None of the participants suffered any known general psychiatric or neurological disease. The study was approved by the Ethics Committee of the Department of Psychology, Sun Yat-Sen University. Apparatus and procedure The procedure in Study 2 was similar to Study 1, except that in Study 2, the Posner peripheral cueing task contained 58 Figure 3. The correlation between IOR-OT and ACE-R score in the older group for Study 1 (A), Study 2 (B), and Studies 1 and 2 combined (C). Table 1. Partial Correlations Between IOR-OT and ACE-R Performance in Older Adults After Controlling for Processing Speed (RT or RT/ACC of the Posner peripheral cueing task), and Age, Respectively Control factor RT RT/ACC Age Study 1 r = −.517** r = −.516** r = −.524** p = .002 p = .002 p = .002 Study 2 r = −.504** r = −.507** r = −.485* p = .009 p = .008 p = .012 Studies 1 and 2 Combined r = .516*** r = −.515*** r = .516*** p < .001 p < .001 p < .001 Notes: RT = Reaction time; ACC = Accuracy. *Correlation is significant at the .05 level (two-tailed). **Correlation is significant at the .01 level (two-tailed). ***Correlation is significant at the .001 level (two-tailed). Journals of Gerontology: PSYCHOLOGICAL SCIENCES, 2020, Vol. 75, No. 4 757 Downloaded from https://academic.oup.com/psychsocgerontology/article/75/4/753/5033575 by Southern Medical University user on 04 May 2022