正在加载图片...
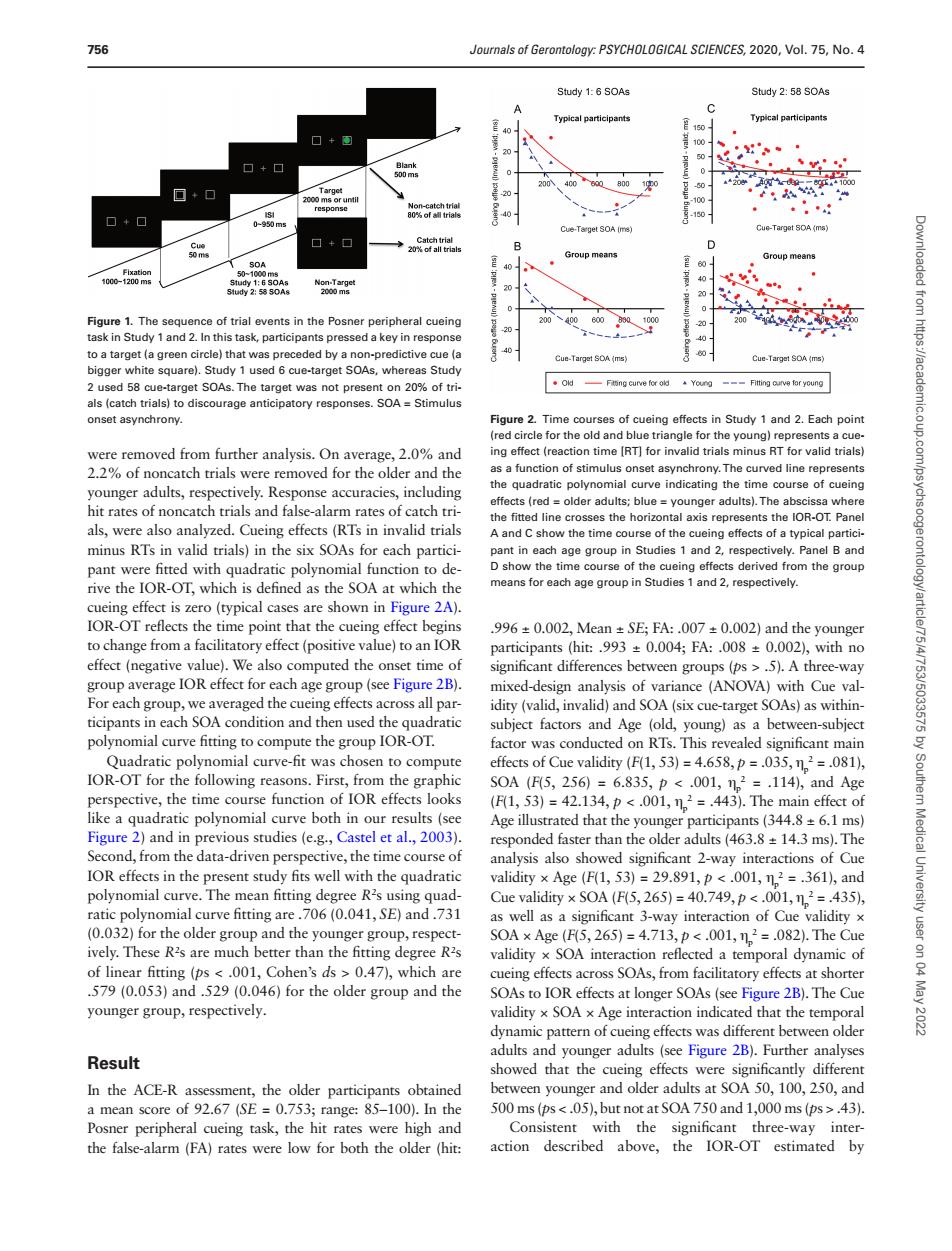
56 of:PSYCHOLGICAL SCIENCES,0,Vol.75,No.4 Typical participants + Cu-tame sr Gpn Group moans te square) sed 6 cu target SOA tch trials)to discourage anticipatory response SOA in Study 1 and 2.Each poir 1e0 2.09 n of stimulus onset asynchrony.The curved ine repres unger adults rest ectively res se accuracies includin hit rates of noncatch trials and false-alarm rates of catchtr r adults:bl dults).Th als,were also analyzed. Cueing effects (RTs in in alid trial the time e of the cue typica minus RIs h pa rive the IOR-OT,which is defined as the SOA at which the means for each age group in Studies1and. cucing effect is zero(typical cases are shown in Figure 2A). IOR-OT reflects the me poin ,996±0.002,Mean±SEFA:.007±0.002)and the younger e)to ar (hit99300o4h:08±002,mhn (sce Fig idity (valid,invalid)and SOA (six cu SOAs)as within ftcipansineach OA co subject factors and Age (old,young)as a between-subject polynomi led IOR-OT for S0A5.256 perspective,the time course function of IOR effects looks 1,53=42.134.p<001.n2 Age illustrated that the you ger pa ipants (344.8+6.1 ms us studies (e.g.,C responded faster than theo er adults (463.8=14.3 ms).The IOR effects an (E(1 53) 298g alidin xS0AF5,2651=40.749,p 2=435 as well as a significant 3-way interaction of Cue validity (0. group,respe a tempo I dynamic o .579 (0.053)and .529 (0.046)for the older group and the 2B).The Cue younger group,respectively. interaction indicated that the tempora dynamic pattern of cueing effects was different between olde adults and yo see Figure 2B) Result unger adults that In the ACE-R 2 particip nd ld 500 ms (ps<.05),but not at SOA 750 and 1.000 ms (s>43) Posner peripheral cueing task,the hit rates were high and Consistent with the significant three-way inter the false-alarm(FA)rates were low for both the older (hit: action described above,the IOR-OT estimated by were removed from further analysis. On average, 2.0% and 2.2% of noncatch trials were removed for the older and the younger adults, respectively. Response accuracies, including hit rates of noncatch trials and false-alarm rates of catch trials, were also analyzed. Cueing effects (RTs in invalid trials minus RTs in valid trials) in the six SOAs for each participant were fitted with quadratic polynomial function to derive the IOR-OT, which is defined as the SOA at which the cueing effect is zero (typical cases are shown in Figure 2A). IOR-OT reflects the time point that the cueing effect begins to change from a facilitatory effect (positive value) to an IOR effect (negative value). We also computed the onset time of group average IOR effect for each age group (see Figure 2B). For each group, we averaged the cueing effects across all participants in each SOA condition and then used the quadratic polynomial curve fitting to compute the group IOR-OT. Quadratic polynomial curve-fit was chosen to compute IOR-OT for the following reasons. First, from the graphic perspective, the time course function of IOR effects looks like a quadratic polynomial curve both in our results (see Figure 2) and in previous studies (e.g., Castel et al., 2003). Second, from the data-driven perspective, the time course of IOR effects in the present study fits well with the quadratic polynomial curve. The mean fitting degree R2 s using quadratic polynomial curve fitting are .706 (0.041, SE) and .731 (0.032) for the older group and the younger group, respectively. These R2 s are much better than the fitting degree R2 s of linear fitting (ps < .001, Cohen’s ds > 0.47), which are .579 (0.053) and .529 (0.046) for the older group and the younger group, respectively. Result In the ACE-R assessment, the older participants obtained a mean score of 92.67 (SE = 0.753; range: 85–100). In the Posner peripheral cueing task, the hit rates were high and the false-alarm (FA) rates were low for both the older (hit: .996 ± 0.002, Mean ± SE; FA: .007 ± 0.002) and the younger participants (hit: .993 ± 0.004; FA: .008 ± 0.002), with no significant differences between groups (ps > .5). A three-way mixed-design analysis of variance (ANOVA) with Cue validity (valid, invalid) and SOA (six cue-target SOAs) as withinsubject factors and Age (old, young) as a between-subject factor was conducted on RTs. This revealed significant main effects of Cue validity (F(1, 53) = 4.658, p = .035, ηp 2 = .081), SOA (F(5, 256) = 6.835, p < .001, ηp 2 = .114), and Age (F(1, 53) = 42.134, p < .001, ηp 2 = .443). The main effect of Age illustrated that the younger participants (344.8 ± 6.1 ms) responded faster than the older adults (463.8 ± 14.3 ms). The analysis also showed significant 2-way interactions of Cue validity × Age (F(1, 53) = 29.891, p < .001, ηp 2 = .361), and Cue validity × SOA (F(5, 265) = 40.749, p < .001, ηp 2 = .435), as well as a significant 3-way interaction of Cue validity × SOA × Age (F(5, 265) = 4.713, p < .001, ηp 2 = .082). The Cue validity × SOA interaction reflected a temporal dynamic of cueing effects across SOAs, from facilitatory effects at shorter SOAs to IOR effects at longer SOAs (see Figure 2B). The Cue validity × SOA × Age interaction indicated that the temporal dynamic pattern of cueing effects was different between older adults and younger adults (see Figure 2B). Further analyses showed that the cueing effects were significantly different between younger and older adults at SOA 50, 100, 250, and 500 ms (ps < .05), but not at SOA 750 and 1,000 ms (ps > .43). Consistent with the significant three-way interaction described above, the IOR-OT estimated by Figure 2. Time courses of cueing effects in Study 1 and 2. Each point (red circle for the old and blue triangle for the young) represents a cueing effect (reaction time [RT] for invalid trials minus RT for valid trials) as a function of stimulus onset asynchrony. The curved line represents the quadratic polynomial curve indicating the time course of cueing effects (red = older adults; blue = younger adults). The abscissa where the fitted line crosses the horizontal axis represents the IOR-OT. Panel A and C show the time course of the cueing effects of a typical participant in each age group in Studies 1 and 2, respectively. Panel B and D show the time course of the cueing effects derived from the group means for each age group in Studies 1 and 2, respectively. Figure 1. The sequence of trial events in the Posner peripheral cueing task in Study 1 and 2. In this task, participants pressed a key in response to a target (a green circle) that was preceded by a non-predictive cue (a bigger white square). Study 1 used 6 cue-target SOAs, whereas Study 2 used 58 cue-target SOAs. The target was not present on 20% of trials (catch trials) to discourage anticipatory responses. SOA = Stimulus onset asynchrony. 756 Journals of Gerontology: PSYCHOLOGICAL SCIENCES, 2020, Vol. 75, No. 4 Downloaded from https://academic.oup.com/psychsocgerontology/article/75/4/753/5033575 by Southern Medical University user on 04 May 2022