正在加载图片...
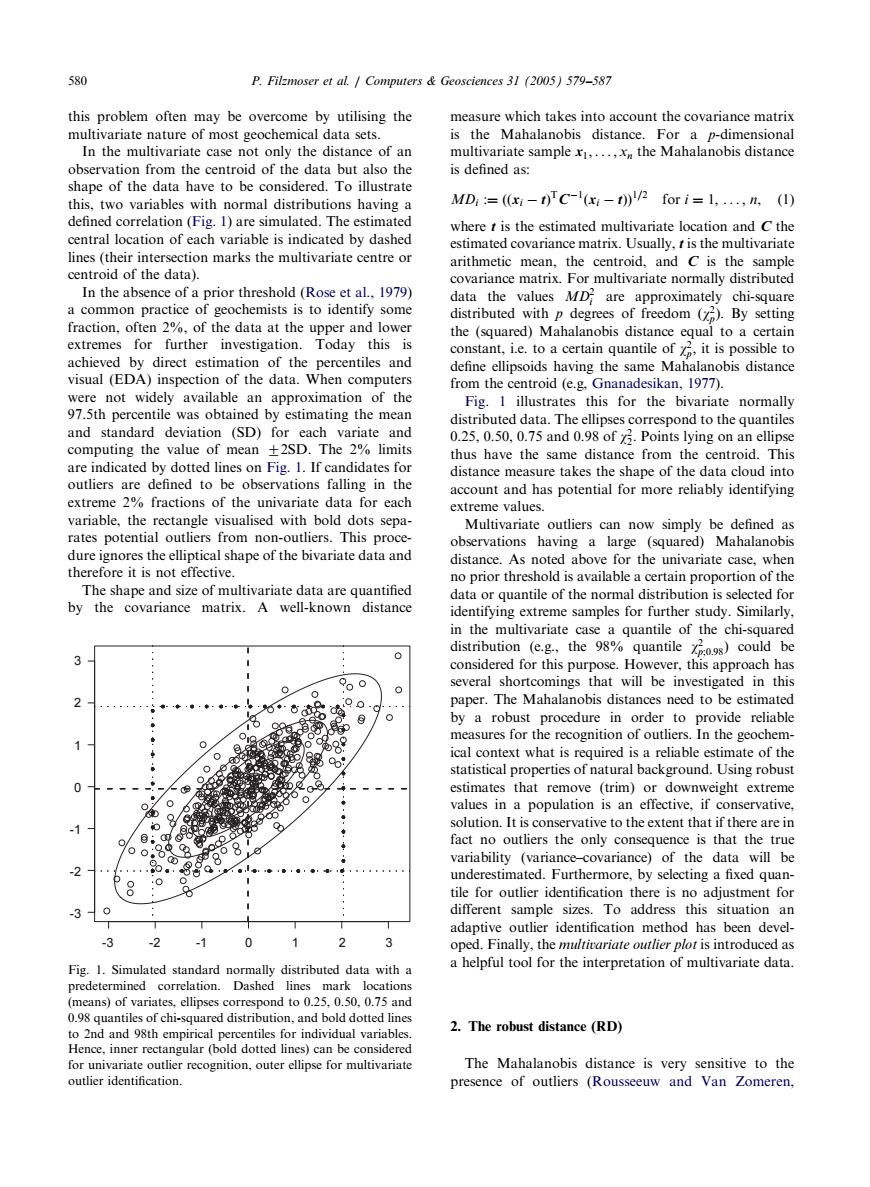
580 P.Filzmoser et al.Computers Geosciences 31 (2005)579-587 this problem often may be overcome by utilising the measure which takes into account the covariance matrix multivariate nature of most geochemical data sets. is the Mahalanobis distance.For a p-dimensional In the multivariate case not only the distance of an multivariate sample x,...,the Mahalanobis distance observation from the centroid of the data but also the is defined as: shape of the data have to be considered.To illustrate this,two variables with normal distributions having a MD=((i-1)TC-l(1))2 for i=1,....n,(1) defined correlation (Fig.1)are simulated.The estimated where t is the estimated multivariate location and C the central location of each variable is indicated by dashed estimated covariance matrix.Usually,t is the multivariate lines (their intersection marks the multivariate centre or arithmetic mean.the centroid.and C is the sample centroid of the data). covariance matrix.For multivariate normally distributed In the absence of a prior threshold (Rose et al..1979) data the values MD are approximately chi-square a common practice of geochemists is to identify some distributed with p degrees of freedom ()By setting fraction,often 2%,of the data at the upper and lower the (squared)Mahalanobis distance equal to a certain extremes for further investigation.Today this is constant,ie.to a certain quantile of it is possible to achieved by direct estimation of the percentiles and define ellipsoids having the same Mahalanobis distance visual (EDA)inspection of the data.When computers from the centroid (e.g,Gnanadesikan,1977). were not widely available an approximation of the Fig.I illustrates this for the bivariate normally 97.5th percentile was obtained by estimating the mean distributed data.The ellipses correspond to the quantiles and standard deviation (SD)for each variate and 0.25.0.50,0.75 and 0.98 of Points lying on an ellipse computing the value of mean +2SD.The 2%limits thus have the same distance from the centroid.This are indicated by dotted lines on Fig.1.If candidates for distance measure takes the shape of the data cloud into outliers are defined to be observations falling in the account and has potential for more reliably identifying extreme 2%fractions of the univariate data for each extreme values. variable,the rectangle visualised with bold dots sepa- Multivariate outliers can now simply be defined as rates potential outliers from non-outliers.This proce- observations having a large (squared)Mahalanobis dure ignores the elliptical shape of the bivariate data and distance.As noted above for the univariate case.when therefore it is not effective. no prior threshold is available a certain proportion of the The shape and size of multivariate data are quantified data or quantile of the normal distribution is selected for by the covariance matrix.A well-known distance identifying extreme samples for further study.Similarly, in the multivariate case a quantile of the chi-squared 0 distribution (e.g.,the 98%quantile 2:9s)could be considered for this purpose.However,this approach has 90 several shortcomings that will be investigated in this 0 6◆·意归 $°。g paper.The Mahalanobis distances need to be estimated by a robust procedure in order to provide reliable measures for the recognition of outliers.In the geochem- ical context what is required is a reliable estimate of the 0 statistical properties of natural background.Using robust estimates that remove (trim)or downweight extreme 0 values in a population is an effective,if conservative, 8 8 solution.It is conservative to the extent that if there are in o:8 8808 fact no outliers the only consequence is that the true variability (variance-covariance)of the data will be 4 8 o underestimated.Furthermore,by selecting a fixed quan- tile for outlier identification there is no adjustment for ● different sample sizes.To address this situation an adaptive outlier identification method has been devel- -2 0 oped.Finally,the multivariate outlier plot is introduced as Fig.1.Simulated standard normally distributed data with a a helpful tool for the interpretation of multivariate data. predetermined correlation.Dashed lines mark locations (means)of variates,ellipses correspond to 0.25,0.50,0.75 and 0.98 quantiles of chi-squared distribution,and bold dotted lines to 2nd and 98th empirical percentiles for individual variables. 2.The robust distance(RD) Hence,inner rectangular(bold dotted lines)can be considered for univariate outlier recognition,outer ellipse for multivariate The Mahalanobis distance is very sensitive to the outlier identification. presence of outliers (Rousseeuw and Van Zomeren,this problem often may be overcome by utilisingthe multivariate nature of most geochemical data sets. In the multivariate case not only the distance of an observation from the centroid of the data but also the shape of the data have to be considered. To illustrate this, two variables with normal distributions havinga defined correlation (Fig. 1) are simulated. The estimated central location of each variable is indicated by dashed lines (their intersection marks the multivariate centre or centroid of the data). In the absence of a prior threshold (Rose et al., 1979) a common practice of geochemists is to identify some fraction, often 2%, of the data at the upper and lower extremes for further investigation. Today this is achieved by direct estimation of the percentiles and visual (EDA) inspection of the data. When computers were not widely available an approximation of the 97.5th percentile was obtained by estimatingthe mean and standard deviation (SD) for each variate and computingthe value of mean 72SD. The 2% limits are indicated by dotted lines on Fig. 1. If candidates for outliers are defined to be observations fallingin the extreme 2% fractions of the univariate data for each variable, the rectangle visualised with bold dots separates potential outliers from non-outliers. This procedure ignores the elliptical shape of the bivariate data and therefore it is not effective. The shape and size of multivariate data are quantified by the covariance matrix. A well-known distance measure which takes into account the covariance matrix is the Mahalanobis distance. For a p-dimensional multivariate sample x1; ... ; xn the Mahalanobis distance is defined as: MDi :¼ ððxi tÞ TC1 ðxi tÞÞ1=2 for i ¼ 1; ... ; n, (1) where t is the estimated multivariate location and C the estimated covariance matrix. Usually, t is the multivariate arithmetic mean, the centroid, and C is the sample covariance matrix. For multivariate normally distributed data the values MD2 i are approximately chi-square distributed with p degrees of freedom ðw2 pÞ: By setting the (squared) Mahalanobis distance equal to a certain constant, i.e. to a certain quantile of w2 p; it is possible to define ellipsoids havingthe same Mahalanobis distance from the centroid (e.g, Gnanadesikan, 1977). Fig. 1 illustrates this for the bivariate normally distributed data. The ellipses correspond to the quantiles 0.25, 0.50, 0.75 and 0.98 of w2 2: Points lyingon an ellipse thus have the same distance from the centroid. This distance measure takes the shape of the data cloud into account and has potential for more reliably identifying extreme values. Multivariate outliers can now simply be defined as observations havinga large (squared) Mahalanobis distance. As noted above for the univariate case, when no prior threshold is available a certain proportion of the data or quantile of the normal distribution is selected for identifyingextreme samples for further study. Similarly, in the multivariate case a quantile of the chi-squared distribution (e.g., the 98% quantile w2 p;0:98) could be considered for this purpose. However, this approach has several shortcomings that will be investigated in this paper. The Mahalanobis distances need to be estimated by a robust procedure in order to provide reliable measures for the recognition of outliers. In the geochemical context what is required is a reliable estimate of the statistical properties of natural background. Using robust estimates that remove (trim) or downweight extreme values in a population is an effective, if conservative, solution. It is conservative to the extent that if there are in fact no outliers the only consequence is that the true variability (variance–covariance) of the data will be underestimated. Furthermore, by selectinga fixed quantile for outlier identification there is no adjustment for different sample sizes. To address this situation an adaptive outlier identification method has been developed. Finally, the multivariate outlier plot is introduced as a helpful tool for the interpretation of multivariate data. 2. The robust distance (RD) The Mahalanobis distance is very sensitive to the presence of outliers (Rousseeuw and Van Zomeren, ARTICLE IN PRESS -3 -2 -1 0 1 -3 -2 -1 0 1 2 3 2 3 Fig. 1. Simulated standard normally distributed data with a predetermined correlation. Dashed lines mark locations (means) of variates, ellipses correspond to 0.25, 0.50, 0.75 and 0.98 quantiles of chi-squared distribution, and bold dotted lines to 2nd and 98th empirical percentiles for individual variables. Hence, inner rectangular (bold dotted lines) can be considered for univariate outlier recognition, outer ellipse for multivariate outlier identification. 580 P. Filzmoser et al. / Computers & Geosciences 31 (2005) 579–587���