正在加载图片...
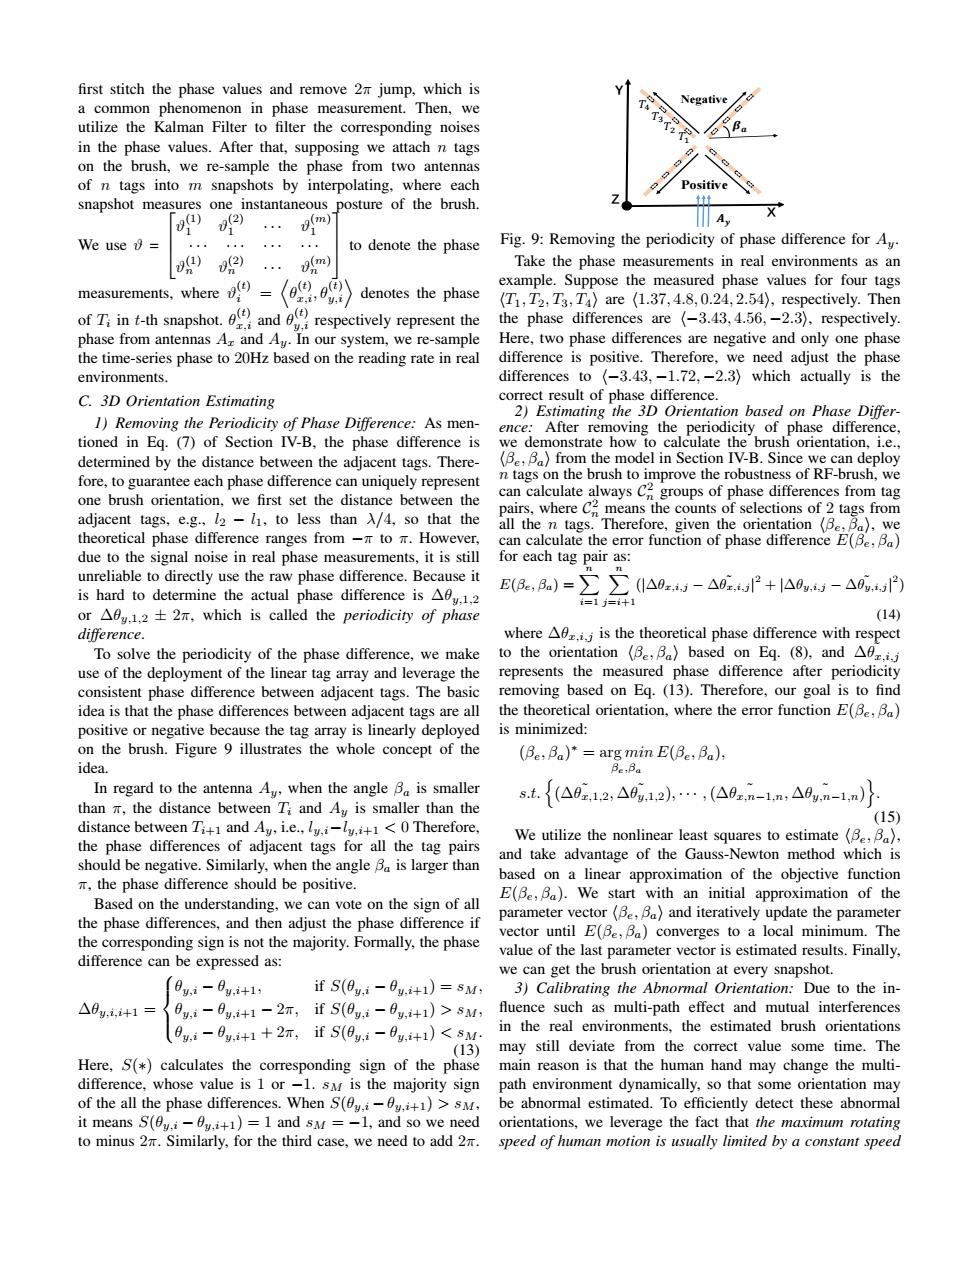
first stitch the phase values and remove 2 jump,which is a common phenomenon in phase measurement.Then,we Negative utilize the Kalman Filter to filter the corresponding noises in the phase values.After that,supposing we attach n tags on the brush,we re-sample the phase from two antennas of n tags into m snapshots by interpolating,where each Positive snapshot measures one instantaneous posture of the brush. ttt y(m) X We use 。。 to denote the phase Fig.9:Removing the periodicity of phase difference for Ay. 02) m Take the phase measurements in real environments as an measurements,where) example.Suppose the measured phase values for four tags denotes the phase (T1,T2,T3,Ta)are (1.37,4.8,0.24,2.54),respectively.Then ofTit-th snapshot.andrespctively represent the the phase differences are (-3.43,4.56,-2.3),respectively. phase from antennas A and Ay.In our system,we re-sample Here,two phase differences are negative and only one phase the time-series phase to 20Hz based on the reading rate in real difference is positive.Therefore,we need adjust the phase environments. differences to (-3.43,-1.72,-2.3)which actually is the C.3D Orientation Estimating correct result of phase difference. 2)Estimating the 3D Orientation based on Phase Differ- 1)Removing the Periodicity of Phase Difference:As men- ence:After removing the periodicity of phase difference, tioned in Eg.(7)of Section IV-B,the phase difference is we demonstrate how to calculate the brush orientation,i.e., determined by the distance between the adjacent tags.There- (Be,Ba)from the model in Section IV-B.Since we can deploy fore,to guarantee each phase difference can uniquely represent n tags on the brush to improve the robustness of RF-brush,we one brush orientation,we first set the distance between the can calculate always C groups of phase differences from tag pairs,where C means the counts of selections of 2 tags from adjacent tags,e.g.,l2-l1,to less than A/4,so that the all the n tags.Therefore,given the orientation (Be,Ba).we theoretical phase difference ranges from to However, can calculate the error function of phase difference E(Be,Ba) due to the signal noise in real phase measurements,it is still for each tag pair as: unreliable to directly use the raw phase difference.Because it is hard to determine the actual phase difference is A0v.1.2 E(Ae,Ba)=∑∑0a0.-△EP+lA0,-△0gf i=1j=i+1 or A0y.1.2 +2m,which is called the periodicity of phase (14) difference. where A.is the theoretical phase difference with respect To solve the periodicity of the phase difference,we make to the orientation (B Ba)based on Eq.(8).and use of the deployment of the linear tag array and leverage the represents the measured phase difference after periodicity consistent phase difference between adjacent tags.The basic removing based on Eq.(13).Therefore,our goal is to find idea is that the phase differences between adjacent tags are all the theoretical orientation,where the error function E(Be,Ba) positive or negative because the tag array is linearly deployed is minimized: on the brush.Figure 9 illustrates the whole concept of the (Be:Ba)*=arg min E(Be:Ba), idea. Be:Ba In regard to the antenna Ay,when the angle Ba is smaller st.{(△921,2,△0g.1,2,…,(△0z,n-1,n,△9g,n-1,n} than m,the distance between Ti and Ay is smaller than the (15) distance between Ti+1 and Ay,i.e.,ly.ly.+1<0Therefore, We utilize the nonlinear least squares to estimate(Be,Ba), the phase differences of adjacent tags for all the tag pairs and take advantage of the Gauss-Newton method which is should be negative.Similarly,when the angle Ba is larger than π,the phase difference should be positive. based on a linear approximation of the objective function E(Be,Ba).We start with an initial approximation of the Based on the understanding,we can vote on the sign of all parameter vector(Be,Ba)and iteratively update the parameter the phase differences,and then adjust the phase difference if vector until E(Be,Ba)converges to a local minimum.The the corresponding sign is not the majority.Formally,the phase value of the last parameter vector is estimated results.Finally, difference can be expressed as: we can get the brush orientation at every snapshot. 0g,i-0y,i+1 if S(Qy.i-0v.1)=sM,3)Calibrating the Abnormal Orientation:Due to the in- △0yi,i+1={9g,i-0g,i+1-2m,ifS(0g,i-0g,i+1)>sM, fluence such as multi-path effect and mutual interferences 0v.i-0v.i+1+2T,if S(0v.i-0v.i+1)<SM. in the real environments,the estimated brush orientations (13)may still deviate from the correct value some time.The Here,S(*)calculates the corresponding sign of the phase main reason is that the human hand may change the multi- difference,whose value is 1 or -1.sM is the majority sign path environment dynamically,so that some orientation may of the all the phase differences.When S(v.-0v.+)>sM, be abnormal estimated.To efficiently detect these abnormal it means S(0y.i-0v.+1)=1 and sM =-1,and so we need orientations,we leverage the fact that the maximum rotating to minus 27.Similarly,for the third case,we need to add 2. speed of human motion is usually limited by a constant speedfirst stitch the phase values and remove 2π jump, which is a common phenomenon in phase measurement. Then, we utilize the Kalman Filter to filter the corresponding noises in the phase values. After that, supposing we attach n tags on the brush, we re-sample the phase from two antennas of n tags into m snapshots by interpolating, where each snapshot measures one instantaneous posture of the brush. We use ϑ = ϑ (1) 1 ϑ (2) 1 · · · ϑ (m) 1 · · · · · · · · · · · · ϑ (1) n ϑ (2) n · · · ϑ (m) n to denote the phase measurements, where ϑ (t) i = D θ (t) x,i, θ(t) y,iE denotes the phase of Ti in t-th snapshot. θ (t) x,i and θ (t) y,i respectively represent the phase from antennas Ax and Ay. In our system, we re-sample the time-series phase to 20Hz based on the reading rate in real environments. C. 3D Orientation Estimating 1) Removing the Periodicity of Phase Difference: As mentioned in Eq. (7) of Section IV-B, the phase difference is determined by the distance between the adjacent tags. Therefore, to guarantee each phase difference can uniquely represent one brush orientation, we first set the distance between the adjacent tags, e.g., l2 − l1, to less than λ/4, so that the theoretical phase difference ranges from −π to π. However, due to the signal noise in real phase measurements, it is still unreliable to directly use the raw phase difference. Because it is hard to determine the actual phase difference is ∆θy,1,2 or ∆θy,1,2 ± 2π, which is called the periodicity of phase difference. To solve the periodicity of the phase difference, we make use of the deployment of the linear tag array and leverage the consistent phase difference between adjacent tags. The basic idea is that the phase differences between adjacent tags are all positive or negative because the tag array is linearly deployed on the brush. Figure 9 illustrates the whole concept of the idea. In regard to the antenna Ay, when the angle βa is smaller than π, the distance between Ti and Ay is smaller than the distance between Ti+1 and Ay, i.e., ly,i−ly,i+1 < 0 Therefore, the phase differences of adjacent tags for all the tag pairs should be negative. Similarly, when the angle βa is larger than π, the phase difference should be positive. Based on the understanding, we can vote on the sign of all the phase differences, and then adjust the phase difference if the corresponding sign is not the majority. Formally, the phase difference can be expressed as: ∆θy,i,i+1 = θy,i − θy,i+1, if S(θy,i − θy,i+1) = sM, θy,i − θy,i+1 − 2π, if S(θy,i − θy,i+1) > sM, θy,i − θy,i+1 + 2π, if S(θy,i − θy,i+1) < sM. (13) Here, S(∗) calculates the corresponding sign of the phase difference, whose value is 1 or −1. sM is the majority sign of the all the phase differences. When S(θy,i −θy,i+1) > sM, it means S(θy,i − θy,i+1) = 1 and sM = −1, and so we need to minus 2π. Similarly, for the third case, we need to add 2π. Z X 𝑨𝒚 Negative Positive Y 𝑇4 𝑇3𝑇2 𝑇1 𝜷𝒂 Fig. 9: Removing the periodicity of phase difference for Ay. Take the phase measurements in real environments as an example. Suppose the measured phase values for four tags hT1, T2, T3, T4i are h1.37, 4.8, 0.24, 2.54i, respectively. Then the phase differences are h−3.43, 4.56, −2.3i, respectively. Here, two phase differences are negative and only one phase difference is positive. Therefore, we need adjust the phase differences to h−3.43, −1.72, −2.3i which actually is the correct result of phase difference. 2) Estimating the 3D Orientation based on Phase Difference: After removing the periodicity of phase difference, we demonstrate how to calculate the brush orientation, i.e., hβe, βai from the model in Section IV-B. Since we can deploy n tags on the brush to improve the robustness of RF-brush, we can calculate always C 2 n groups of phase differences from tag pairs, where C 2 n means the counts of selections of 2 tags from all the n tags. Therefore, given the orientation hβe, βai, we can calculate the error function of phase difference E(βe, βa) for each tag pair as: E(βe, βa) = Xn i=1 Xn j=i+1 (|∆θx,i,j − ∆ ˜θx,i,j | 2 + |∆θy,i,j − ∆ ˜θy,i,j | 2 ) (14) where ∆θx,i,j is the theoretical phase difference with respect to the orientation hβe, βai based on Eq. (8), and ∆ ˜θx,i,j represents the measured phase difference after periodicity removing based on Eq. (13). Therefore, our goal is to find the theoretical orientation, where the error function E(βe, βa) is minimized: (βe, βa) ∗ = arg min βe,βa E(βe, βa), s.t. n (∆ ˜θx,1,2, ∆ ˜θy,1,2), · · · ,(∆ ˜ θx,n−1,n, ∆ ˜ θy,n−1,n) o . (15) We utilize the nonlinear least squares to estimate hβe, βai, and take advantage of the Gauss-Newton method which is based on a linear approximation of the objective function E(βe, βa). We start with an initial approximation of the parameter vector hβe, βai and iteratively update the parameter vector until E(βe, βa) converges to a local minimum. The value of the last parameter vector is estimated results. Finally, we can get the brush orientation at every snapshot. 3) Calibrating the Abnormal Orientation: Due to the in- fluence such as multi-path effect and mutual interferences in the real environments, the estimated brush orientations may still deviate from the correct value some time. The main reason is that the human hand may change the multipath environment dynamically, so that some orientation may be abnormal estimated. To efficiently detect these abnormal orientations, we leverage the fact that the maximum rotating speed of human motion is usually limited by a constant speed