正在加载图片...

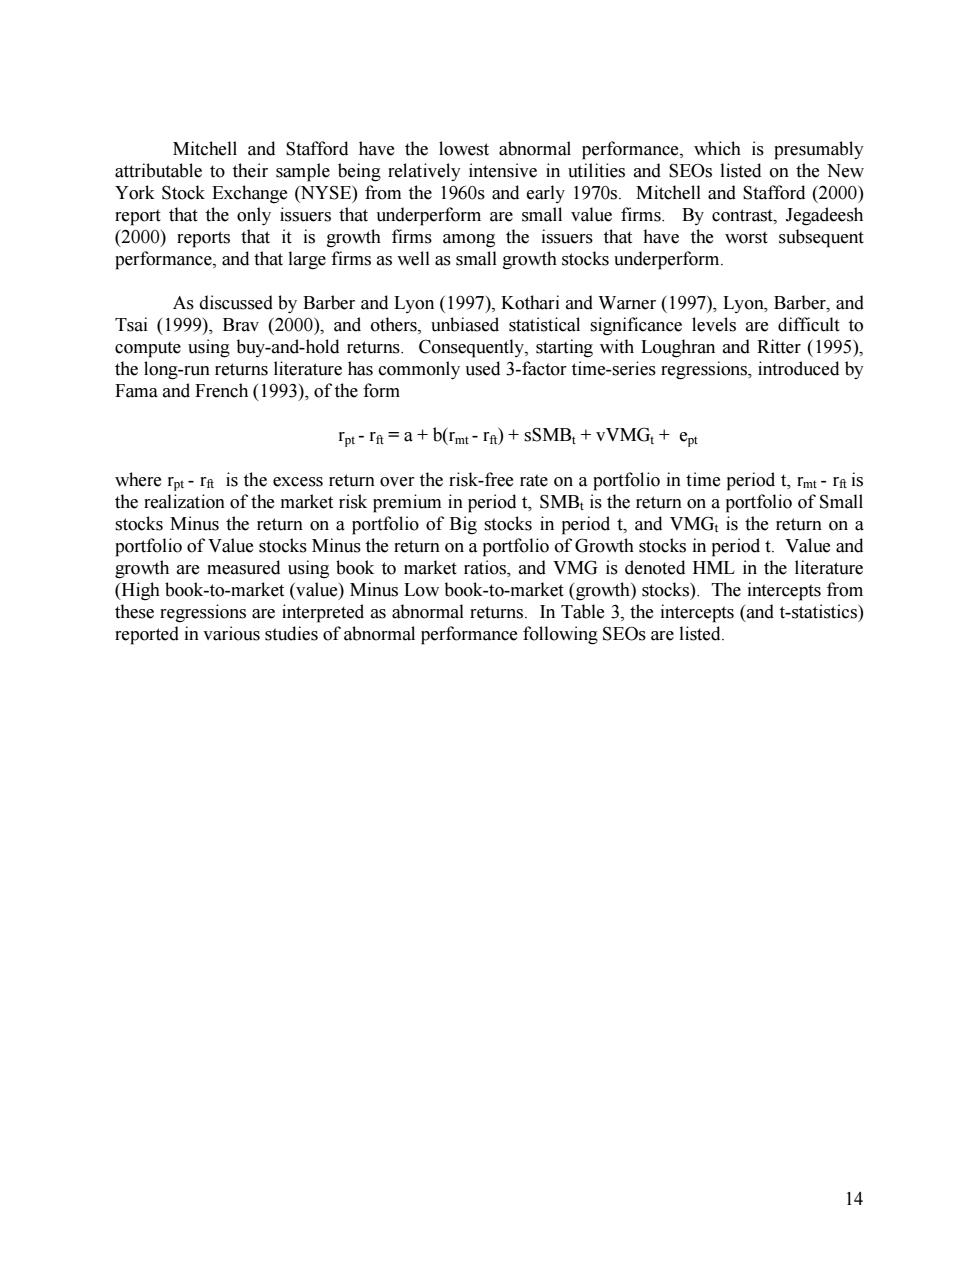
Mitchell and Stafford have the lowest abnormal performance,which is presumably attributable to their sample being relatively intensive in utilities and SEOs listed on the New York Stock Exchange (NYSE)from the 1960s and early 1970s.Mitchell and Stafford (2000) report that the only issuers that underperform are small value firms.By contrast,Jegadeesh (2000)reports that it is growth firms among the issuers that have the worst subsequent performance,and that large firms as well as small growth stocks underperform. As discussed by Barber and Lyon(1997),Kothari and Warner(1997),Lyon,Barber,and Tsai (1999),Brav (2000),and others,unbiased statistical significance levels are difficult to compute using buy-and-hold returns.Consequently,starting with Loughran and Ritter (1995), the long-run returns literature has commonly used 3-factor time-series regressions,introduced by Fama and French(1993),of the form rpt-ra a b(rmt-ra)+SSMBt VVMGt ept where rpt-ra is the excess return over the risk-free rate on a portfolio in time period t,rmt-ra is the realization of the market risk premium in period t,SMBt is the return on a portfolio of Small stocks Minus the return on a portfolio of Big stocks in period t,and VMGt is the return on a portfolio of Value stocks Minus the return on a portfolio of Growth stocks in period t.Value and growth are measured using book to market ratios,and VMG is denoted HML in the literature (High book-to-market(value)Minus Low book-to-market (growth)stocks).The intercepts from these regressions are interpreted as abnormal returns.In Table 3,the intercepts (and t-statistics) reported in various studies of abnormal performance following SEOs are listed. 1414 Mitchell and Stafford have the lowest abnormal performance, which is presumably attributable to their sample being relatively intensive in utilities and SEOs listed on the New York Stock Exchange (NYSE) from the 1960s and early 1970s. Mitchell and Stafford (2000) report that the only issuers that underperform are small value firms. By contrast, Jegadeesh (2000) reports that it is growth firms among the issuers that have the worst subsequent performance, and that large firms as well as small growth stocks underperform. As discussed by Barber and Lyon (1997), Kothari and Warner (1997), Lyon, Barber, and Tsai (1999), Brav (2000), and others, unbiased statistical significance levels are difficult to compute using buy-and-hold returns. Consequently, starting with Loughran and Ritter (1995), the long-run returns literature has commonly used 3-factor time-series regressions, introduced by Fama and French (1993), of the form rpt - rft = a + b(rmt - rft) + sSMBt + vVMGt + ept where rpt - rft is the excess return over the risk-free rate on a portfolio in time period t, rmt - rft is the realization of the market risk premium in period t, SMBt is the return on a portfolio of Small stocks Minus the return on a portfolio of Big stocks in period t, and VMGt is the return on a portfolio of Value stocks Minus the return on a portfolio of Growth stocks in period t. Value and growth are measured using book to market ratios, and VMG is denoted HML in the literature (High book-to-market (value) Minus Low book-to-market (growth) stocks). The intercepts from these regressions are interpreted as abnormal returns. In Table 3, the intercepts (and t-statistics) reported in various studies of abnormal performance following SEOs are listed