正在加载图片...
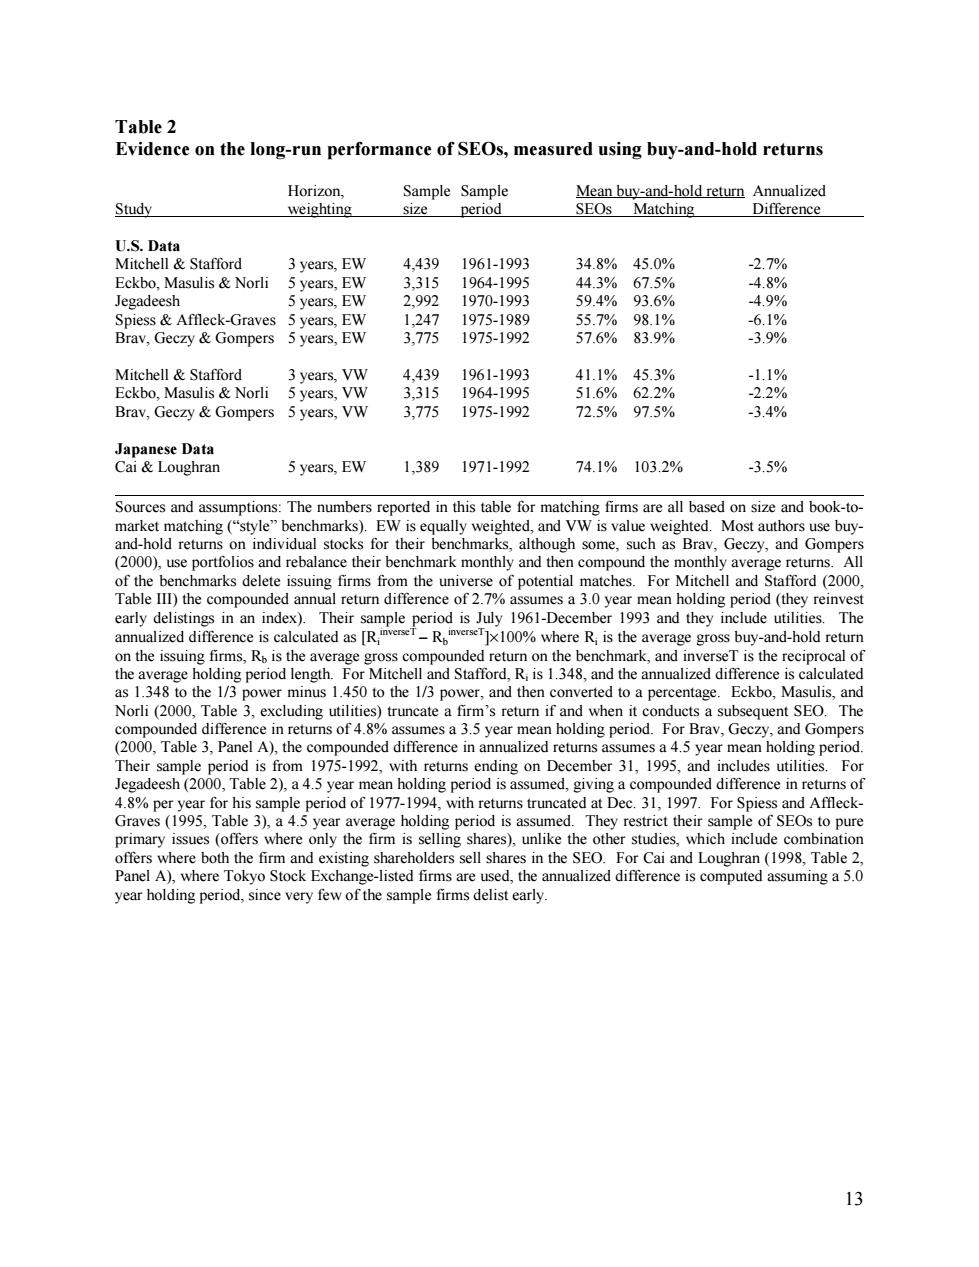
Table 2 Evidence on the long-run performance of SEOs,measured using buy-and-hold returns Horizon. SampleSample Mean buy-and-hold return Annualized Study weighting size period SEOs Matching Difference U.S.Data Mitchell Stafford 3 years,EW 4.439 1961-1993 34.8%45.0% -2.7% Eckbo.Masulis Norli 5 years,EW 3,315 1964-1995 44.3% 67.5% -4.8% Jegadeesh 5 years,EW 2.992 1970-1993 59.4% 93.6% -4.9% Spiess Affleck-Graves 5 years,EW 1.247 1975-1989 55.7% 98.1% -6.1% Brav,Geczy Gompers 5 years,EW 3,775 1975-1992 57.6% 83.9% -3.9% Mitchell Stafford 3 years,VW 4.439 1961-1993 41.1% 45.3% -1.1% Eckbo.Masulis Norli 5 years,VW 3.315 1964-1995 51.6% 62.2% -2.2% Brav,Geczy Gompers 5 years,VW 3,775 1975-1992 72.5% 97.5% -3.4% Japanese Data Cai Loughran 5 years,EW 1.389 1971-1992 74.1% 103.2% -3.5% Sources and assumptions:The numbers reported in this table for matching firms are all based on size and book-to- market matching("style"benchmarks).EW is equally weighted,and VW is value weighted.Most authors use buy- and-hold returns on individual stocks for their benchmarks,although some,such as Brav,Geczy,and Gompers (2000),use portfolios and rebalance their benchmark monthly and then compound the monthly average returns.All of the benchmarks delete issuing firms from the universe of potential matches.For Mitchell and Stafford(2000, Table III)the compounded annual return difference of 2.7%assumes a 3.0 year mean holding period(they reinvest early delistings in an index).Their sample period is July 1961-December 1993 and they include utilities.The annualized difference is calculated as [RTR00%where R is the average gross buy-and-hold return on the issuing firms,Ro is the average gross compounded return on the benchmark,and inverseT is the reciprocal of the average holding period length.For Mitchell and Stafford,R is 1.348,and the annualized difference is calculated as 1.348 to the 1/3 power minus 1.450 to the 1/3 power,and then converted to a percentage.Eckbo,Masulis,and Norli(2000,Table 3,excluding utilities)truncate a firm's return if and when it conducts a subsequent SEO.The compounded difference in returns of 4.8%assumes a 3.5 year mean holding period.For Brav,Geczy,and Gompers (2000,Table 3,Panel A),the compounded difference in annualized returns assumes a 4.5 year mean holding period. Their sample period is from 1975-1992,with returns ending on December 31,1995,and includes utilities.For Jegadeesh(2000,Table 2),a 4.5 year mean holding period is assumed,giving a compounded difference in returns of 4.8%per year for his sample period of 1977-1994,with returns truncated at Dec.31,1997.For Spiess and Affleck- Graves(1995,Table 3),a 4.5 year average holding period is assumed.They restrict their sample of SEOs to pure primary issues (offers where only the firm is selling shares),unlike the other studies,which include combination offers where both the firm and existing shareholders sell shares in the SEO.For Cai and Loughran(1998,Table 2. Panel A),where Tokyo Stock Exchange-listed firms are used,the annualized difference is computed assuming a 5.0 year holding period,since very few of the sample firms delist early. 1313 Table 2 Evidence on the long-run performance of SEOs, measured using buy-and-hold returns Horizon, Sample Sample Mean buy-and-hold return Annualized Study weighting size period SEOs Matching Difference U.S. Data Mitchell & Stafford 3 years, EW 4,439 1961-1993 34.8% 45.0% -2.7% Eckbo, Masulis & Norli 5 years, EW 3,315 1964-1995 44.3% 67.5% -4.8% Jegadeesh 5 years, EW 2,992 1970-1993 59.4% 93.6% -4.9% Spiess & Affleck-Graves 5 years, EW 1,247 1975-1989 55.7% 98.1% -6.1% Brav, Geczy & Gompers 5 years, EW 3,775 1975-1992 57.6% 83.9% -3.9% Mitchell & Stafford 3 years, VW 4,439 1961-1993 41.1% 45.3% -1.1% Eckbo, Masulis & Norli 5 years, VW 3,315 1964-1995 51.6% 62.2% -2.2% Brav, Geczy & Gompers 5 years, VW 3,775 1975-1992 72.5% 97.5% -3.4% Japanese Data Cai & Loughran 5 years, EW 1,389 1971-1992 74.1% 103.2% -3.5% Sources and assumptions: The numbers reported in this table for matching firms are all based on size and book-tomarket matching (“style” benchmarks). EW is equally weighted, and VW is value weighted. Most authors use buyand-hold returns on individual stocks for their benchmarks, although some, such as Brav, Geczy, and Gompers (2000), use portfolios and rebalance their benchmark monthly and then compound the monthly average returns. All of the benchmarks delete issuing firms from the universe of potential matches. For Mitchell and Stafford (2000, Table III) the compounded annual return difference of 2.7% assumes a 3.0 year mean holding period (they reinvest early delistings in an index). Their sample period is July 1961-December 1993 and they include utilities. The annualized difference is calculated as [Ri inverseT – Rb inverseT]×100% where Ri is the average gross buy-and-hold return on the issuing firms, Rb is the average gross compounded return on the benchmark, and inverseT is the reciprocal of the average holding period length. For Mitchell and Stafford, Ri is 1.348, and the annualized difference is calculated as 1.348 to the 1/3 power minus 1.450 to the 1/3 power, and then converted to a percentage. Eckbo, Masulis, and Norli (2000, Table 3, excluding utilities) truncate a firm’s return if and when it conducts a subsequent SEO. The compounded difference in returns of 4.8% assumes a 3.5 year mean holding period. For Brav, Geczy, and Gompers (2000, Table 3, Panel A), the compounded difference in annualized returns assumes a 4.5 year mean holding period. Their sample period is from 1975-1992, with returns ending on December 31, 1995, and includes utilities. For Jegadeesh (2000, Table 2), a 4.5 year mean holding period is assumed, giving a compounded difference in returns of 4.8% per year for his sample period of 1977-1994, with returns truncated at Dec. 31, 1997. For Spiess and AffleckGraves (1995, Table 3), a 4.5 year average holding period is assumed. They restrict their sample of SEOs to pure primary issues (offers where only the firm is selling shares), unlike the other studies, which include combination offers where both the firm and existing shareholders sell shares in the SEO. For Cai and Loughran (1998, Table 2, Panel A), where Tokyo Stock Exchange-listed firms are used, the annualized difference is computed assuming a 5.0 year holding period, since very few of the sample firms delist early