正在加载图片...
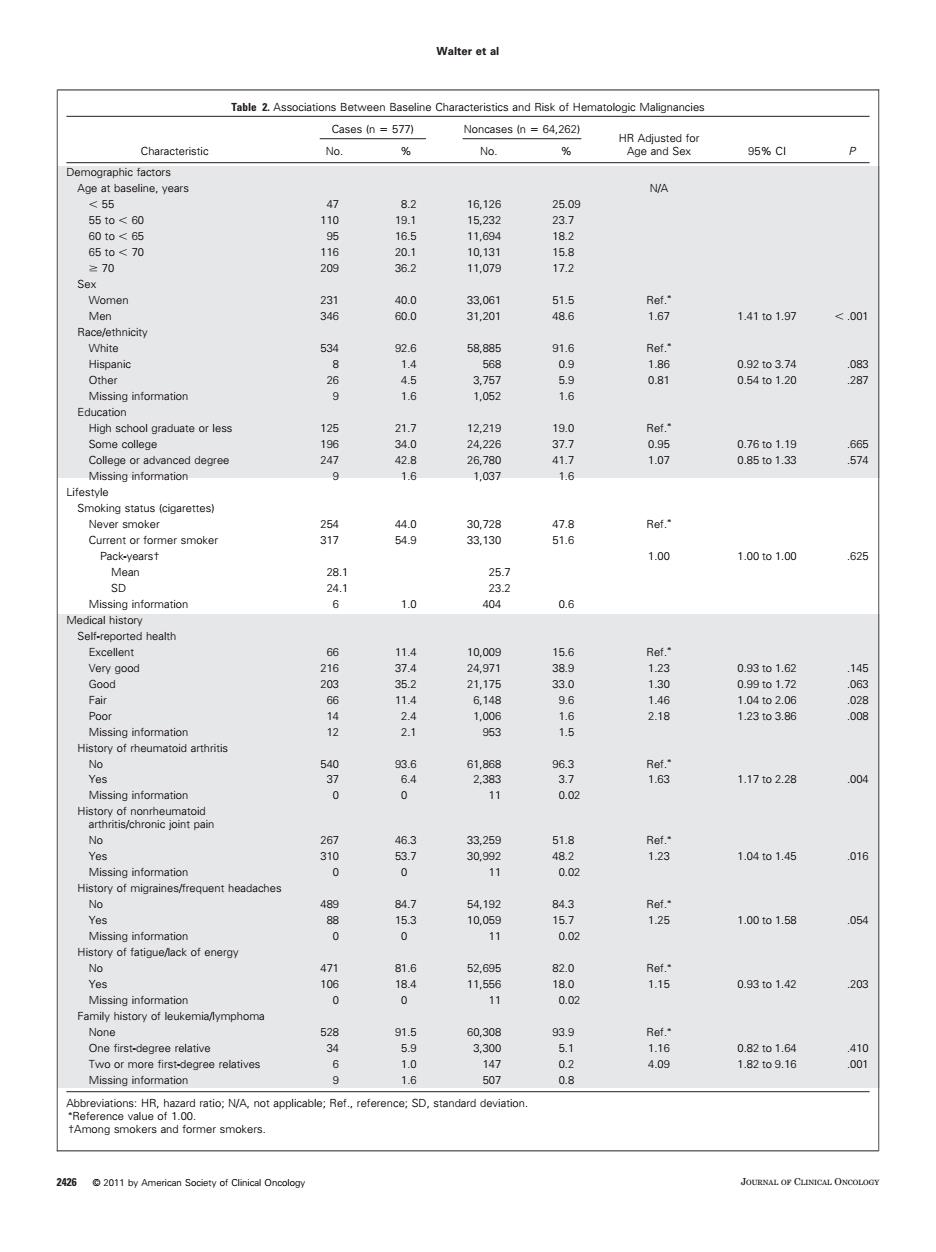
Table2.ssion Between Baseline Characteristisand Riskof Hematologic Malignancies Cases (n 577) Noncases (n -64,262) No % No. % 95%C1 graphic factors 410第10 19160 Wome 36 光 141o1.97 <.001 30141515 8 d degree 87形819 3 3股2网 78 Ref.* 100 1.00t01.00 6 源146 1.0 1031122 8819 1.171o2.28 004 sing infor 00 40 00 1.04o1.45 016 船 1.00to1.58 05 700 03to142 D ....t.. mer smokers JOUENAL OP CLINICAL ONOOLOGY Table 2. Associations Between Baseline Characteristics and Risk of Hematologic Malignancies Characteristic Cases (n 577) Noncases (n 64,262) HR Adjusted for No. % No. % Age and Sex 95% CI P Demographic factors Age at baseline, years N/A 55 47 8.2 16,126 25.09 55 to 60 110 19.1 15,232 23.7 60 to 65 95 16.5 11,694 18.2 65 to 70 116 20.1 10,131 15.8 70 209 36.2 11,079 17.2 Sex Women 231 40.0 33,061 51.5 Ref. Men 346 60.0 31,201 48.6 1.67 1.41 to 1.97 .001 Race/ethnicity White 534 92.6 58,885 91.6 Ref. Hispanic 8 1.4 568 0.9 1.86 0.92 to 3.74 .083 Other 26 4.5 3,757 5.9 0.81 0.54 to 1.20 .287 Missing information 9 1.6 1,052 1.6 Education High school graduate or less 125 21.7 12,219 19.0 Ref. Some college 196 34.0 24,226 37.7 0.95 0.76 to 1.19 .665 College or advanced degree 247 42.8 26,780 41.7 1.07 0.85 to 1.33 .574 Missing information 9 1.6 1,037 1.6 Lifestyle Smoking status (cigarettes) Never smoker 254 44.0 30,728 47.8 Ref. Current or former smoker 317 54.9 33,130 51.6 Pack-years† 1.00 1.00 to 1.00 .625 Mean 28.1 25.7 SD 24.1 23.2 Missing information 6 1.0 404 0.6 Medical history Self-reported health Excellent 66 11.4 10,009 15.6 Ref. Very good 216 37.4 24,971 38.9 1.23 0.93 to 1.62 .145 Good 203 35.2 21,175 33.0 1.30 0.99 to 1.72 .063 Fair 66 11.4 6,148 9.6 1.46 1.04 to 2.06 .028 Poor 14 2.4 1,006 1.6 2.18 1.23 to 3.86 .008 Missing information 12 2.1 953 1.5 History of rheumatoid arthritis No 540 93.6 61,868 96.3 Ref. Yes 37 6.4 2,383 3.7 1.63 1.17 to 2.28 .004 Missing information 0 0 11 0.02 History of nonrheumatoid arthritis/chronic joint pain No 267 46.3 33,259 51.8 Ref. Yes 310 53.7 30,992 48.2 1.23 1.04 to 1.45 .016 Missing information 0 0 11 0.02 History of migraines/frequent headaches No 489 84.7 54,192 84.3 Ref. Yes 88 15.3 10,059 15.7 1.25 1.00 to 1.58 .054 Missing information 0 0 11 0.02 History of fatigue/lack of energy No 471 81.6 52,695 82.0 Ref. Yes 106 18.4 11,556 18.0 1.15 0.93 to 1.42 .203 Missing information 0 0 11 0.02 Family history of leukemia/lymphoma None 528 91.5 60,308 93.9 Ref. One first-degree relative 34 5.9 3,300 5.1 1.16 0.82 to 1.64 .410 Two or more first-degree relatives 6 1.0 147 0.2 4.09 1.82 to 9.16 .001 Missing information 9 1.6 507 0.8 Abbreviations: HR, hazard ratio; N/A, not applicable; Ref., reference; SD, standard deviation. Reference value of 1.00. †Among smokers and former smokers. Walter et al 2426 © 2011 by American Society of Clinical Oncology JOURNAL OF CLINICAL ONCOLOGY�����