正在加载图片...
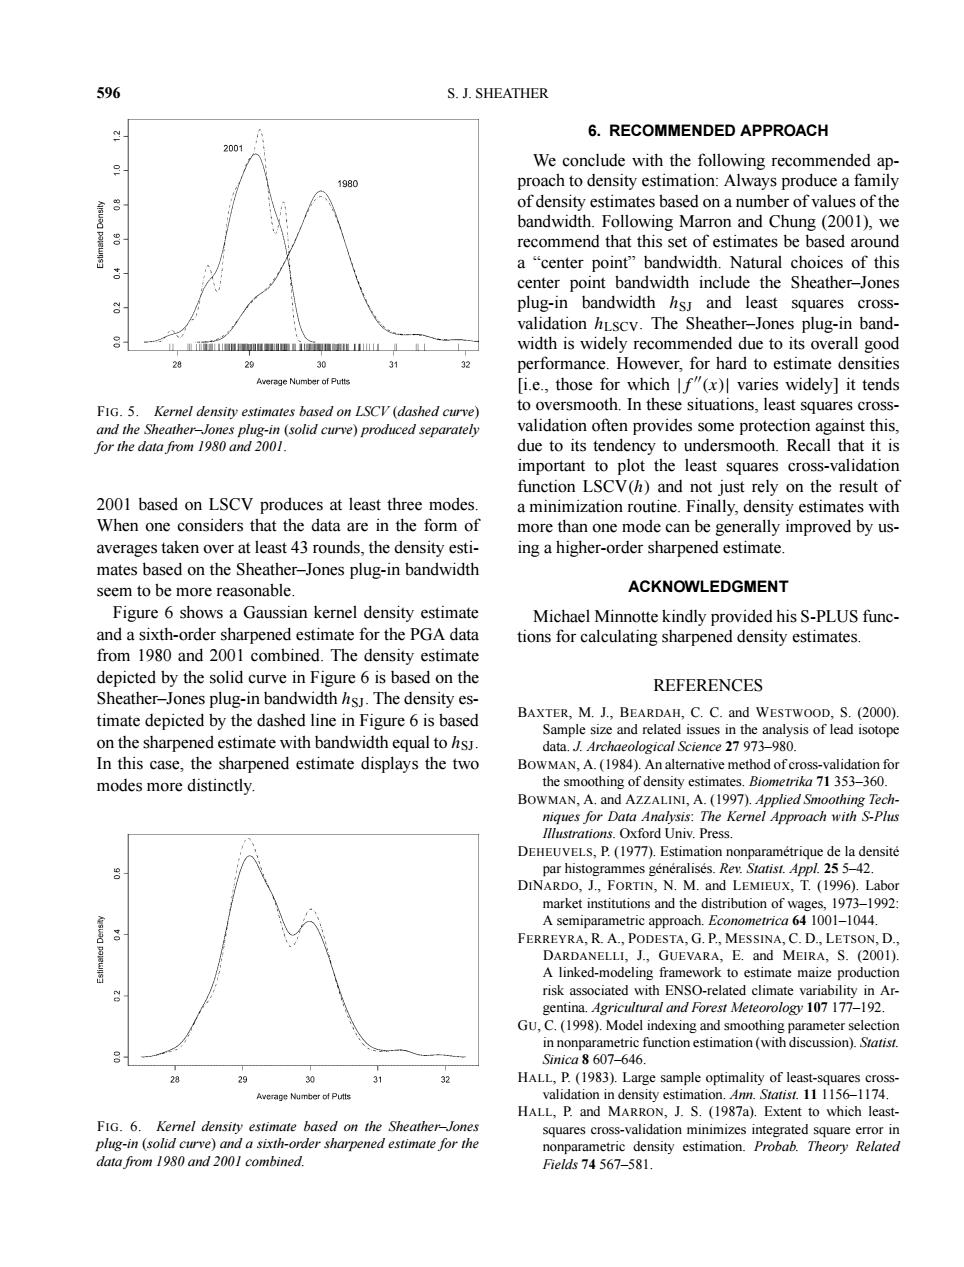
596 S.J.SHEATHER 6.RECOMMENDED APPROACH 2001 We conclude with the following recommended ap- 1980 proach to density estimation:Always produce a family of density estimates based on a number of values of the bandwidth.Following Marron and Chung (2001),we recommend that this set of estimates be based around a "center point"bandwidth.Natural choices of this center point bandwidth include the Sheather-Jones plug-in bandwidth hs]and least squares cross- validation hLscv.The Sheather-Jones plug-in band- width is widely recommended due to its overall good 29 30 performance.However,for hard to estimate densities Average Number of Putts [i.e.,those for which If"(x)I varies widely]it tends FIG.5.Kernel density estimates based on LSCV (dashed curve) to oversmooth.In these situations,least squares cross- and the Sheather-Jones plug-in (solid curve)produced separately validation often provides some protection against this, for the data from 1980 and 2001. due to its tendency to undersmooth.Recall that it is important to plot the least squares cross-validation function LSCV(h)and not just rely on the result of 2001 based on LSCV produces at least three modes. a minimization routine.Finally,density estimates with When one considers that the data are in the form of more than one mode can be generally improved by us- averages taken over at least 43 rounds,the density esti- ing a higher-order sharpened estimate. mates based on the Sheather-Jones plug-in bandwidth seem to be more reasonable. ACKNOWLEDGMENT Figure 6 shows a Gaussian kernel density estimate Michael Minnotte kindly provided his S-PLUS func- and a sixth-order sharpened estimate for the PGA data tions for calculating sharpened density estimates. from 1980 and 2001 combined.The density estimate depicted by the solid curve in Figure 6 is based on the REFERENCES Sheather-Jones plug-in bandwidth hsJ.The density es- timate depicted by the dashed line in Figure 6 is based BAXTER,M.J.,BEARDAH,C.C.and WESTWOOD,S.(2000). Sample size and related issues in the analysis of lead isotope on the sharpened estimate with bandwidth equal to hsJ data.J.Archaeological Science 27 973-980. In this case,the sharpened estimate displays the two BOWMAN,A.(1984).An alternative method of cross-validation for modes more distinctly the smoothing of density estimates.Biometrika 71 353-360. BOWMAN,A.and AZZALINI,A.(1997).Applied Smoothing Tech- niques for Data Analysis:The Kernel Approach with S-Plus Illustrations.Oxford Univ.Press. DEHEUVELS,P.(1977).Estimation nonparametrique de la densite par histogrammes generalises.Rev.Statist.Appl.25 5-42. DINARDO,J.,FORTIN,N.M.and LEMIEUX,T.(1996).Labor market institutions and the distribution of wages,1973-1992: A semiparametric approach.Econometrica 64 1001-1044. FERREYRA,R.A.,PODESTA,G.P.,MESSINA,C.D.,LETSON,D. DARDANELLI,J.,GUEVARA,E.and MEIRA,S.(2001). A linked-modeling framework to estimate maize production risk associated with ENSO-related climate variability in Ar- gentina.Agricultral and Forest Meteorology 107 177-192. GU,C.(1998).Model indexing and smoothing parameter selection in nonparametric function estimation (with discussion).Statist. Sinica8607-646. HALL,P.(1983).Large sample optimality of least-squares cross- Average Number o时Puts validation in density estimation.Ann.Statist.11 1156-1174. HALL,P.and MARRON,J.S.(1987a).Extent to which least- FIG.6.Kernel density estimate based on the Sheather-Jones squares cross-validation minimizes integrated square error in plug-in (solid curve)and a sixth-order sharpened estimate for the nonparametric density estimation.Probab.Theory Related data from 1980 and 2001 combined. Fields74567-581.596 S. J. SHEATHER FIG. 5. Kernel density estimates based on LSCV (dashed curve) and the Sheather–Jones plug-in (solid curve) produced separately for the data from 1980 and 2001. 2001 based on LSCV produces at least three modes. When one considers that the data are in the form of averages taken over at least 43 rounds, the density estimates based on the Sheather–Jones plug-in bandwidth seem to be more reasonable. Figure 6 shows a Gaussian kernel density estimate and a sixth-order sharpened estimate for the PGA data from 1980 and 2001 combined. The density estimate depicted by the solid curve in Figure 6 is based on the Sheather–Jones plug-in bandwidth hSJ. The density estimate depicted by the dashed line in Figure 6 is based on the sharpened estimate with bandwidth equal to hSJ. In this case, the sharpened estimate displays the two modes more distinctly. FIG. 6. Kernel density estimate based on the Sheather–Jones plug-in (solid curve) and a sixth-order sharpened estimate for the data from 1980 and 2001 combined. 6. RECOMMENDED APPROACH We conclude with the following recommended approach to density estimation: Always produce a family of density estimates based on a number of values of the bandwidth. Following Marron and Chung (2001), we recommend that this set of estimates be based around a “center point” bandwidth. Natural choices of this center point bandwidth include the Sheather–Jones plug-in bandwidth hSJ and least squares crossvalidation hLSCV. The Sheather–Jones plug-in bandwidth is widely recommended due to its overall good performance. However, for hard to estimate densities [i.e., those for which |f (x)| varies widely] it tends to oversmooth. In these situations, least squares crossvalidation often provides some protection against this, due to its tendency to undersmooth. Recall that it is important to plot the least squares cross-validation function LSCV(h) and not just rely on the result of a minimization routine. Finally, density estimates with more than one mode can be generally improved by using a higher-order sharpened estimate. ACKNOWLEDGMENT Michael Minnotte kindly provided his S-PLUS functions for calculating sharpened density estimates. REFERENCES BAXTER, M. J., BEARDAH, C. C. and WESTWOOD, S. (2000). Sample size and related issues in the analysis of lead isotope data. J. Archaeological Science 27 973–980. BOWMAN, A. (1984). An alternative method of cross-validation for the smoothing of density estimates. Biometrika 71 353–360. BOWMAN, A. and AZZALINI, A. (1997). Applied Smoothing Techniques for Data Analysis: The Kernel Approach with S-Plus Illustrations. Oxford Univ. Press. DEHEUVELS, P. (1977). Estimation nonparamétrique de la densité par histogrammes généralisés. Rev. Statist. Appl. 25 5–42. DINARDO, J., FORTIN, N. M. and LEMIEUX, T. (1996). Labor market institutions and the distribution of wages, 1973–1992: A semiparametric approach. Econometrica 64 1001–1044. FERREYRA, R. A., PODESTA, G. P., MESSINA, C. D., LETSON, D., DARDANELLI, J., GUEVARA, E. and MEIRA, S. (2001). A linked-modeling framework to estimate maize production risk associated with ENSO-related climate variability in Argentina. Agricultural and Forest Meteorology 107 177–192. GU, C. (1998). Model indexing and smoothing parameter selection in nonparametric function estimation (with discussion). Statist. Sinica 8 607–646. HALL, P. (1983). Large sample optimality of least-squares crossvalidation in density estimation. Ann. Statist. 11 1156–1174. HALL, P. and MARRON, J. S. (1987a). Extent to which leastsquares cross-validation minimizes integrated square error in nonparametric density estimation. Probab. Theory Related Fields 74 567–581.��