正在加载图片...

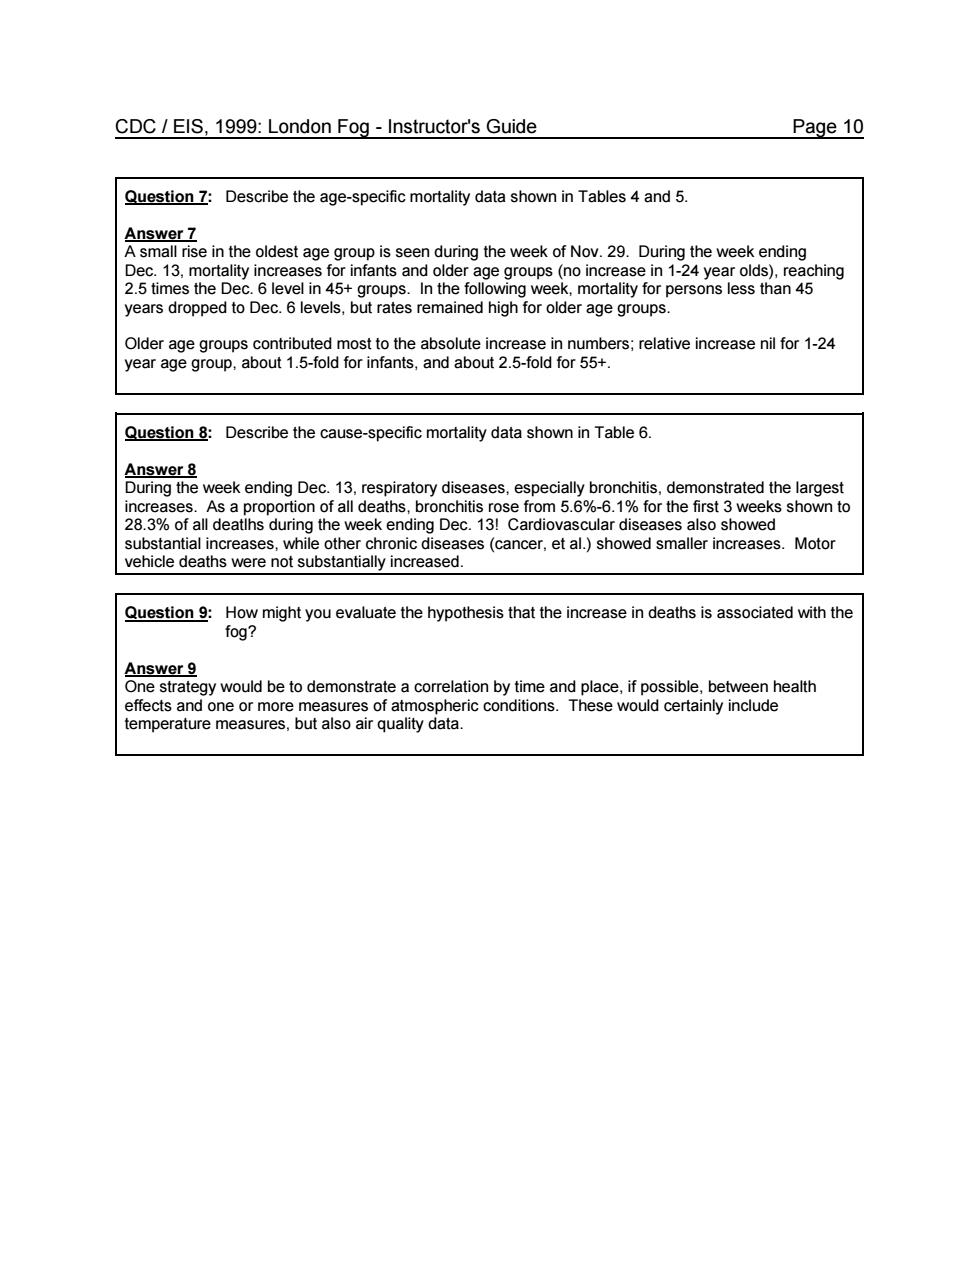
CDC/EIS,1999:London Fog-Instructor's Guide Page 10 Question 7:Describe the age-specific mortality data shown in Tables 4 and 5. Answer 7 in the oldest age Dec.13.morta eas8m729eakueeacning aeourng the wek oo2 During the weekd ing week,mortality for persons less than 45 years dropped to Dec.6 levels,but rates remained high for older age groups. Older age groups contributed most to the absolute increase in numbers;relative increase nil for 1-24 year age group.about 1.5-fold for infants,and about 2.5-fold for 55+. Question 8:Describe the cause-specific mortality data shown in Table 6. Answer 8 tratoa 283%of all deatins during the week ending Dec.13!Cardiovascular diseases also showed ath crea. oth ed ses(cancer.et al.)showed smaller increases.Motor Question 9:How might you evaluate the hypothesis that the increase in deaths is associated with the fog? Answer 9 One strategy would be to demonstrate a correlation by time and place,if possible.between health effects and one or moCDC / EIS, 1999: London Fog - Instructor's Guide Page 10 Question 7: Describe the age-specific mortality data shown in Tables 4 and 5. Answer 7 A small rise in the oldest age group is seen during the week of Nov. 29. During the week ending Dec. 13, mortality increases for infants and older age groups (no increase in 1-24 year olds), reaching 2.5 times the Dec. 6 level in 45+ groups. In the following week, mortality for persons less than 45 years dropped to Dec. 6 levels, but rates remained high for older age groups. Older age groups contributed most to the absolute increase in numbers; relative increase nil for 1-24 year age group, about 1.5-fold for infants, and about 2.5-fold for 55+. Question 8: Describe the cause-specific mortality data shown in Table 6. Answer 8 During the week ending Dec. 13, respiratory diseases, especially bronchitis, demonstrated the largest increases. As a proportion of all deaths, bronchitis rose from 5.6%-6.1% for the first 3 weeks shown to 28.3% of all deatlhs during the week ending Dec. 13! Cardiovascular diseases also showed substantial increases, while other chronic diseases (cancer, et al.) showed smaller increases. Motor vehicle deaths were not substantially increased. Question 9: How might you evaluate the hypothesis that the increase in deaths is associated with the fog? Answer 9 One strategy would be to demonstrate a correlation by time and place, if possible, between health effects and one or more measures of atmospheric conditions. These would certainly include temperature measures, but also air quality data