正在加载图片...
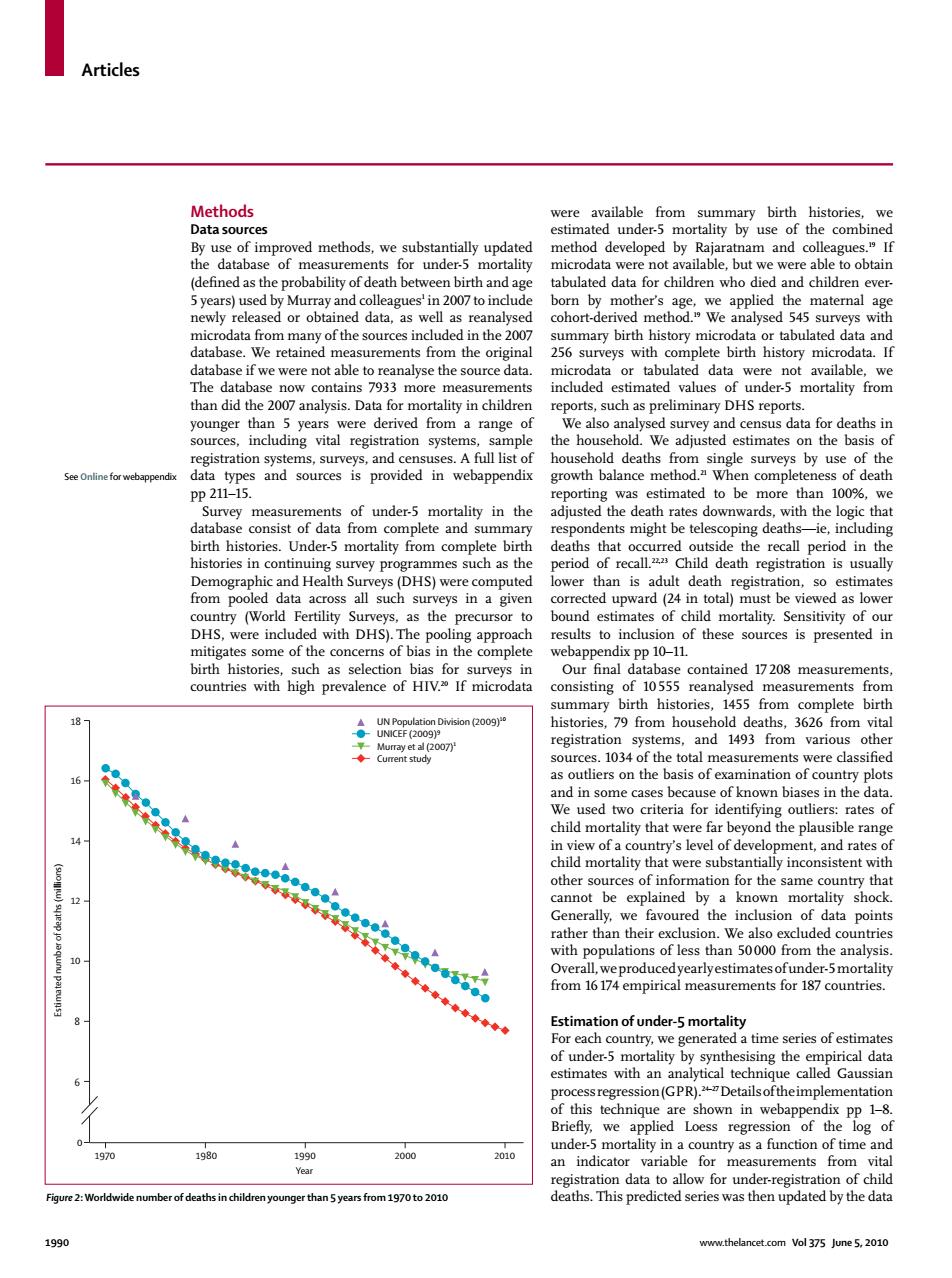
Articles Methods were available from summary birth histories,we Data sources estimated under-5 mortality by use of the combined By use of improved methods,we substantially updated method developed by Rajaratnam and colleagues.If the database of measurements for under-5 mortality microdata were not available,but we were able to obtain (defined as the probability of death between birth and age tabulated data for children who died and children ever- 5 years)used by Murray and colleagues'in 2007 to include born by mother's age,we applied the maternal age newly released or obtained data,as well as reanalysed cohort-derived method.We analysed 545 surveys with microdata from many of the sources included in the 2007 summary birth history microdata or tabulated data and database.We retained measurements from the original 256 surveys with complete birth history microdata.If database if we were not able to reanalyse the source data. microdata or tabulated data were not available,we The database now contains 7933 more measurements included estimated values of under-5 mortality from than did the 2007 analysis.Data for mortality in children reports,such as preliminary DHS reports. younger than 5 years were derived from a range of We also analysed survey and census data for deaths in sources,including vital registration systems,sample the household.We adjusted estimates on the basis of registration systems,surveys,and censuses.A full list of household deaths from single surveys by use of the See Online for webappendix data types and sources is provided in webappendix growth balance method."When completeness of death pp211-15. reporting was estimated to be more than 100%,we Survey measurements of under-5 mortality in the adjusted the death rates downwards.with the logic that database consist of data from complete and summary respondents might be telescoping deaths-ie,including birth histories.Under-5 mortality from complete birth deaths that occurred outside the recall period in the histories in continuing survey programmes such as the period of recall.Child death registration is usually Demographic and Health Surveys(DHS)were computed lower than is adult death registration,so estimates from pooled data across all such surveys in a given corrected upward(24 in total)must be viewed as lower country (World Fertility Surveys,as the precursor to bound estimates of child mortality.Sensitivity of our DHS,were included with DHS).The pooling approach results to inclusion of these sources is presented in mitigates some of the concerns of bias in the complete webappendix pp 10-11. birth histories,such as selection bias for surveys in Our final database contained 17208 measurements, countries with high prevalence of HIV.%If microdata consisting of 10555 reanalysed measurements from summary birth histories,1455 from complete birth 18 UN Population Division (2009) histories,79 from household deaths,3626 from vital ●UNICEF(2009)9 平Murray et al(2007j registration systems,and 1493 from various other sources.1034 of the total measurements were classified 16 ●● as outliers on the basis of examination of country plots and in some cases because of known biases in the data. We used two criteria for identifying outliers:rates of child mortality that were far beyond the plausible range 14 12 10 N in view of a country's level of development,and rates of child mortality that were substantially inconsistent with other sources of information for the same country that cannot be explained by a known mortality shock. 香分量量量神◆◆◆ Generally,we favoured the inclusion of data points rather than their exclusion.We also excluded countries with populations of less than 50000 from the analysis Overall,we produced yearlyestimates ofunder-5mortality from 16 174 empirical measurements for 187 countries. Estimation of under-5 mortality For each country,we generated a time series of estimates of under-5 mortality by synthesising the empirical data estimates with an analytical technique called Gaussian processregression(GPR).2"Detailsoftheimplementation of this technique are shown in webappendix pp 1-8. Briefly,we applied Loess regression of the log of under-5 mortality in a country as a function of time and 1970 1980 1990 2000 2010 an indicator variable for measurements from vital Year registration data to allow for under-registration of child Figure 2:Worldwide number of deaths in children younger than 5 years from 1970 to 2010 deaths.This predicted series was then updated by the data 1990 www.thelancet.com Vol 375 June 5,2010Articles 1990 www.thelancet.com Vol 375 June 5, 2010 Methods Data sources By use of improved methods, we substantially updated the database of measurements for under-5 mortality (defi ned as the probability of death between birth and age 5 years) used by Murray and colleagues1 in 2007 to include newly released or obtained data, as well as reanalysed microdata from many of the sources included in the 2007 database. We retained measurements from the original database if we were not able to reanalyse the source data. The database now contains 7933 more measurements than did the 2007 analysis. Data for mortality in children younger than 5 years were derived from a range of sources, including vital registration systems, sample registration systems, surveys, and censuses. A full list of data types and sources is provided in webappendix pp 211–15. Survey measurements of under-5 mortality in the database consist of data from complete and summary birth histories. Under-5 mortality from complete birth histories in continuing survey programmes such as the Demographic and Health Surveys (DHS) were computed from pooled data across all such surveys in a given country (World Fertility Surveys, as the precursor to DHS, were included with DHS). The pooling approach mitigates some of the concerns of bias in the complete birth histories, such as selection bias for surveys in countries with high prevalence of HIV.20 If microdata were available from summary birth histories, we estimated under-5 mortality by use of the combined method developed by Rajaratnam and colleagues.19 If microdata were not available, but we were able to obtain tabulated data for children who died and children everborn by mother’s age, we applied the maternal age cohort-derived method.19 We analysed 545 surveys with summary birth history microdata or tabulated data and 256 surveys with complete birth history microdata. If microdata or tabulated data were not available, we included estimated values of under-5 mortality from reports, such as preliminary DHS reports. We also analysed survey and census data for deaths in the household. We adjusted estimates on the basis of household deaths from single surveys by use of the growth balance method.21 When completeness of death reporting was estimated to be more than 100%, we adjusted the death rates downwards, with the logic that respondents might be telescoping deaths—ie, including deaths that occurred outside the recall period in the period of recall.22,23 Child death registration is usually lower than is adult death registration, so estimates corrected upward (24 in total) must be viewed as lower bound estimates of child mortality. Sensitivity of our results to inclusion of these sources is presented in webappendix pp 10–11. Our fi nal database contained 17 208 measurements, consisting of 10 555 reanalysed measurements from summary birth histories, 1455 from complete birth histories, 79 from household deaths, 3626 from vital registration systems, and 1493 from various other sources. 1034 of the total measurements were classifi ed as outliers on the basis of examination of country plots and in some cases because of known biases in the data. We used two criteria for identifying outliers: rates of child mortality that were far beyond the plausible range in view of a country’s level of development, and rates of child mortality that were substantially inconsistent with other sources of information for the same country that cannot be explained by a known mortality shock. Generally, we favoured the inclusion of data points rather than their exclusion. We also excluded countries with populations of less than 50 000 from the analysis. Overall, we produced yearly estimates of under-5 mortality from 16 174 empirical measurements for 187 countries. Estimation of under-5 mortality For each country, we generated a time series of estimates of under-5 mortality by synthesising the empirical data estimates with an analytical technique called Gaussian process regression (GPR).24–27 Details of the implementation of this technique are shown in webappendix pp 1–8. Briefl y, we applied Loess regression of the log of under-5 mortality in a country as a function of time and an indicator variable for measurements from vital registration data to allow for under-registration of child Figure 2: Worldwide number of deaths in children younger than 5 years from 1970 to 2010 deaths. This predicted series was then updated by the data UN Population Division (2009)10 UNICEF (2009)9 Murray et al (2007)1 Current study 0 1970 1980 1990 Year Estimated number of deaths (millions) 2000 2010 8 6 10 12 14 16 18 See Online for webappendix