正在加载图片...
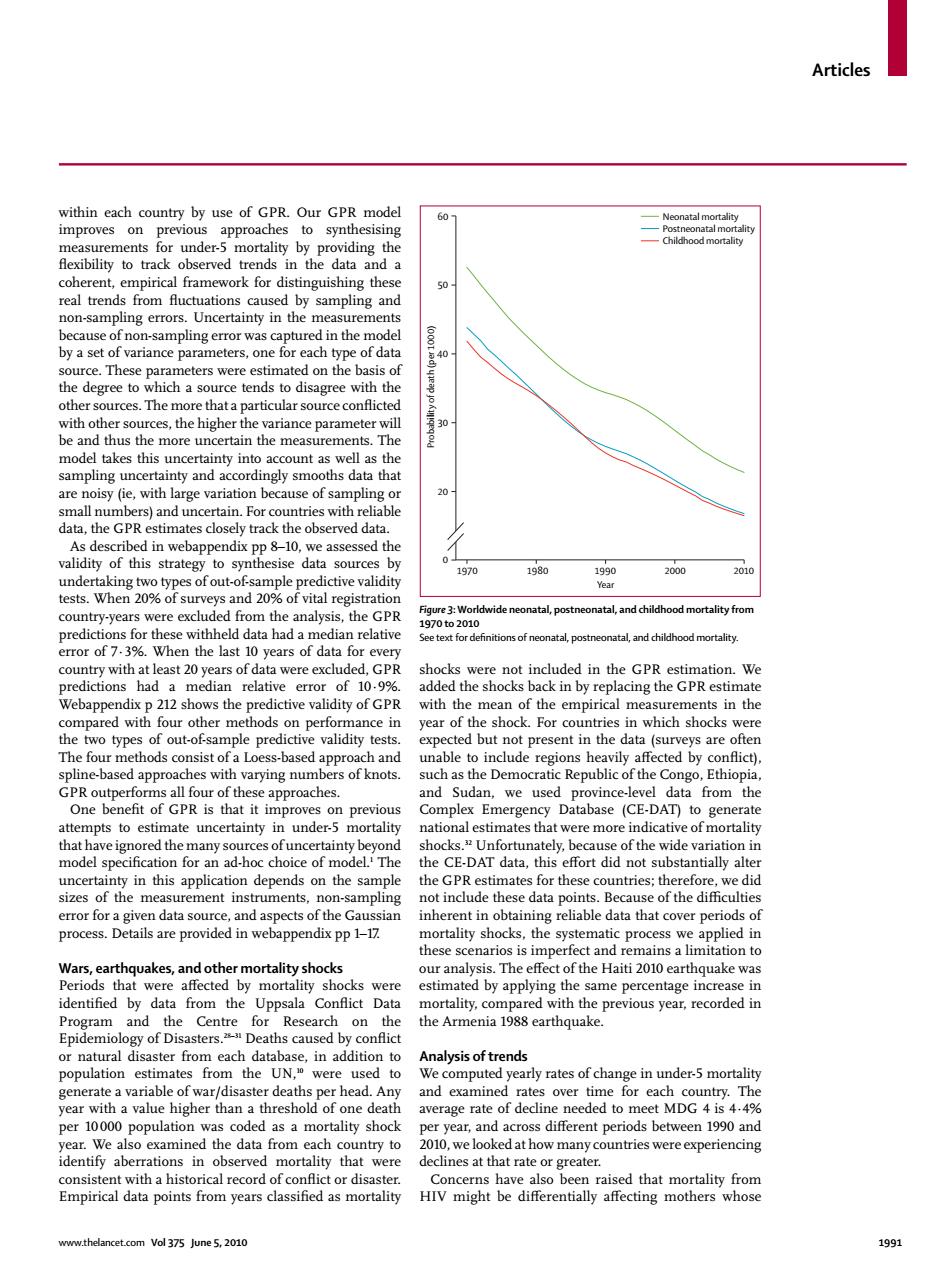
Articles within each country by use of GPR.Our GPR model 60 Neonatal mortality improves on previous approaches to synthesising Postneonatal mortality measurements for under-5 mortality by providing the 一Childhood mortality flexibility to track observed trends in the data and a coherent,empirical framework for distinguishing these 50 real trends from fluctuations caused by sampling and non-sampling errors.Uncertainty in the measurements because of non-sampling error was captured in the model by a set of variance parameters,one for each type of data 40 source.These parameters were estimated on the basis of the degree to which a source tends to disagree with the other sources.The more that a particular source conflicted with other sources,the higher the variance parameter will be and thus the more uncertain the measurements.The model takes this uncertainty into account as well as the sampling uncertainty and accordingly smooths data that are noisy(ie,with large variation because of sampling or 20- small numbers)and uncertain.For countries with reliable data,the GPR estimates closely track the observed data. As described in webappendix pp 8-10,we assessed the validity of this strategy to synthesise data sources by 01 1970 1980 1990 2000 2010 undertaking two types of out-of sample predictive validity Year tests.When 20%of surveys and 20%of vital registration country-years were excluded from the analysis,the GPR Figure 3:Worldwide neonatal,postneonatal,and childhood mortality from 1970to2010 predictions for these withheld data had a median relative Seetext for definitions of neonatal,postneonatal,and chilhood mortality. error of 7.3%.When the last 10 years of data for every country with at least 20 years of data were excluded,GPR shocks were not included in the GPR estimation.We predictions had a median relative error of 10.9%. added the shocks back in by replacing the GPR estimate Webappendix p 212 shows the predictive validity of GPR with the mean of the empirical measurements in the compared with four other methods on performance in year of the shock.For countries in which shocks were the two types of out-of-sample predictive validity tests. expected but not present in the data (surveys are often The four methods consist of a Loess-based approach and unable to include regions heavily affected by confict). spline-based approaches with varying numbers of knots. such as the Democratic Republic of the Congo,Ethiopia, GPR outperforms all four of these approaches. and Sudan,we used province-level data from the One benefit of GPR is that it improves on previous Complex Emergency Database (CE-DAT)to generate attempts to estimate uncertainty in under-5 mortality national estimates that were more indicative of mortality that have ignored the many sources of uncertainty beyond shocks."Unfortunately,because of the wide variation in model specification for an ad-hoc choice of model.'The the CE-DAT data.this effort did not substantially alter uncertainty in this application depends on the sample the GPR estimates for these countries;therefore,we did sizes of the measurement instruments.non-sampling not include these data points.Because of the difficulties error for a given data source,and aspects of the Gaussian inherent in obtaining reliable data that cover periods of process.Details are provided in webappendix pp 1-17 mortality shocks,the systematic process we applied in these scenarios is imperfect and remains a limitation to Wars,earthquakes,and other mortality shocks our analysis.The effect of the Haiti 2010 earthquake was Periods that were affected by mortality shocks were estimated by applying the same percentage increase in identified by data from the Uppsala Conflict Data mortality,compared with the previous year,recorded in Program and the Centre for Research on the the Armenia 1988 earthquake. Epidemiology of Disasters.Deaths caused by conflict or natural disaster from each database,in addition to Analysis of trends population estimates from the UN,were used to We computed yearly rates of change in under-5 mortality generate a variable of war/disaster deaths per head.Any and examined rates over time for each country.The year with a value higher than a threshold of one death average rate of decline needed to meet MDG 4 is 4.4% per 10000 population was coded as a mortality shock per year,and across different periods between 1990 and year.We also examined the data from each country to 2010,we looked at how many countries were experiencing identify aberrations in observed mortality that were declines at that rate or greater. consistent with a historical record of conflict or disaster. Concerns have also been raised that mortality from Empirical data points from years classified as mortality HIV might be differentially affecting mothers whose www.thelancet.com Vol 375 June 5,2010 1991Articles www.thelancet.com Vol 375 June 5, 2010 1991 within each country by use of GPR. Our GPR model improves on previous approaches to synthesising measurements for under-5 mortality by providing the fl exibility to track observed trends in the data and a coherent, empirical framework for distinguishing these real trends from fl uctuations caused by sampling and non-sampling errors. Uncertainty in the measurements because of non-sampling error was captured in the model by a set of variance parameters, one for each type of data source. These parameters were estimated on the basis of the degree to which a source tends to disagree with the other sources. The more that a particular source confl icted with other sources, the higher the variance parameter will be and thus the more uncertain the measurements. The model takes this uncertainty into account as well as the sampling uncertainty and accordingly smooths data that are noisy (ie, with large variation because of sampling or small numbers) and uncertain. For countries with reliable data, the GPR estimates closely track the observed data. As described in webappendix pp 8–10, we assessed the validity of this strategy to synthesise data sources by undertaking two types of out-of-sample predictive validity tests. When 20% of surveys and 20% of vital registration country-years were excluded from the analysis, the GPR predictions for these withheld data had a median relative error of 7·3%. When the last 10 years of data for every country with at least 20 years of data were excluded, GPR predictions had a median relative error of 10·9%. Webappendix p 212 shows the predictive validity of GPR compared with four other methods on performance in the two types of out-of-sample predictive validity tests. The four methods consist of a Loess-based approach and spline-based approaches with varying numbers of knots. GPR outperforms all four of these approaches. One benefi t of GPR is that it improves on previous attempts to estimate uncertainty in under-5 mortality that have ignored the many sources of uncertainty beyond model specifi cation for an ad-hoc choice of model.1 The uncertainty in this application depends on the sample sizes of the measurement instruments, non-sampling error for a given data source, and aspects of the Gaussian process. Details are provided in webappendix pp 1–17. Wars, earthquakes, and other mortality shocks Periods that were aff ected by mortality shocks were identifi ed by data from the Uppsala Confl ict Data Program and the Centre for Research on the Epidemiology of Disasters.28–31 Deaths caused by confl ict or natural disaster from each database, in addition to population estimates from the UN,10 were used to generate a variable of war/disaster deaths per head. Any year with a value higher than a threshold of one death per 10 000 population was coded as a mortality shock year. We also examined the data from each country to identify aberrations in observed mortality that were consistent with a historical record of confl ict or disaster. Empirical data points from years classifi ed as mortality shocks were not included in the GPR estimation. We added the shocks back in by replacing the GPR estimate with the mean of the empirical measurements in the year of the shock. For countries in which shocks were expected but not present in the data (surveys are often unable to include regions heavily aff ected by confl ict), such as the Democratic Republic of the Congo, Ethiopia, and Sudan, we used province-level data from the Complex Emergency Database (CE-DAT) to generate national estimates that were more indicative of mortality shocks.32 Unfortunately, because of the wide variation in the CE-DAT data, this eff ort did not substantially alter the GPR estimates for these countries; therefore, we did not include these data points. Because of the diffi culties inherent in obtaining reliable data that cover periods of mortality shocks, the systematic process we applied in these scenarios is imperfect and remains a limitation to our analysis. The eff ect of the Haiti 2010 earthquake was estimated by applying the same percentage increase in mortality, compared with the previous year, recorded in the Armenia 1988 earthquake. Analysis of trends We computed yearly rates of change in under-5 mortality and examined rates over time for each country. The average rate of decline needed to meet MDG 4 is 4·4% per year, and across diff erent periods between 1990 and 2010, we looked at how many countries were experiencing declines at that rate or greater. Concerns have also been raised that mortality from HIV might be diff erentially aff ecting mothers whose Figure 3: Worldwide neonatal, postneonatal, and childhood mortality from 1970 to 2010 See text for defi nitions of neonatal, postneonatal, and childhood mortality. 1970 Probability of death (per 1000) 0 20 30 40 50 60 Neonatal mortality Postneonatal mortality Childhood mortality 1980 1990 Year 2000 2010