正在加载图片...
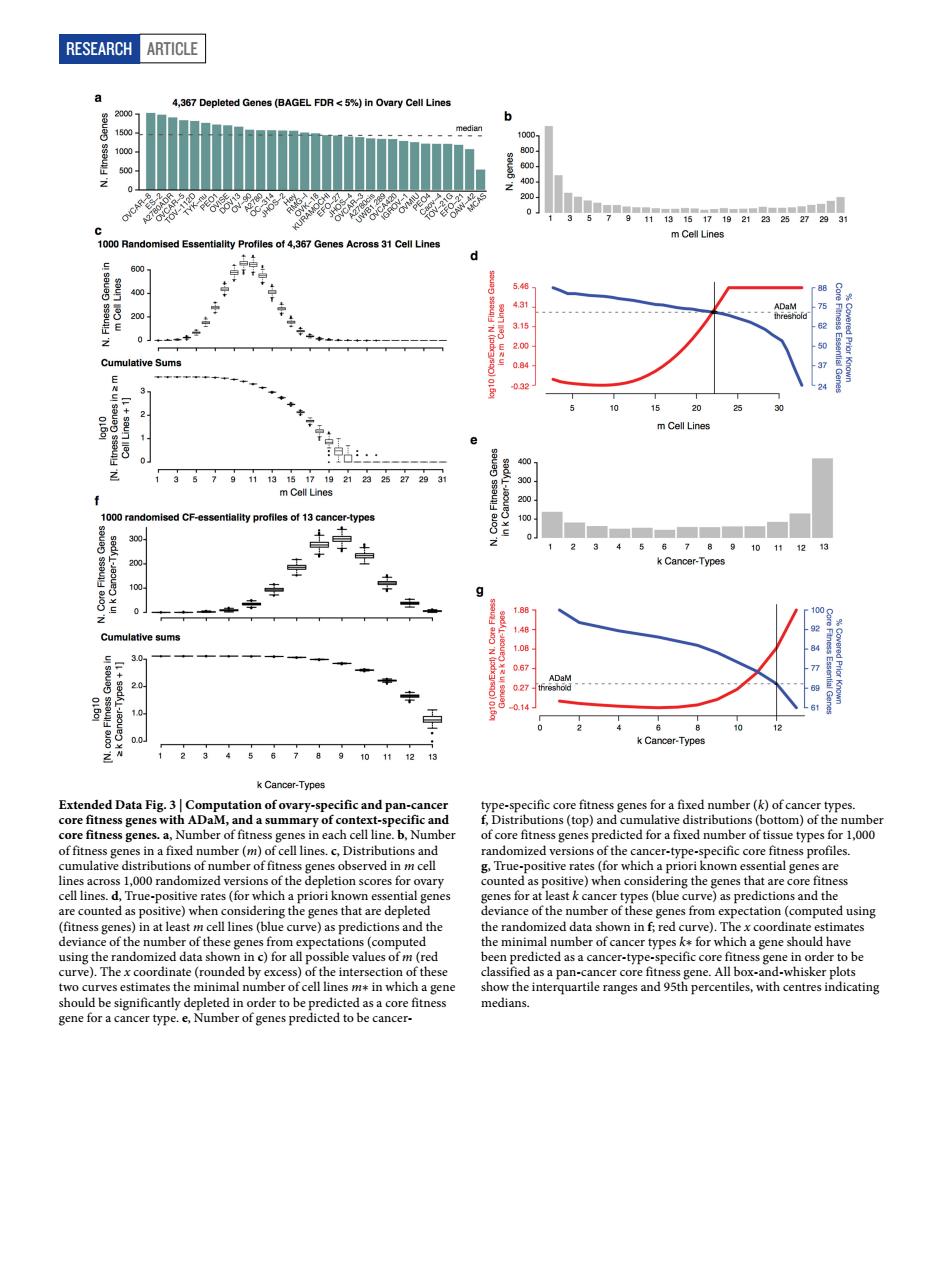
RESEARCH ARTICLE BAGEL FDR 25%)In Ovary Co Line mCel Lines 5 10 m Cel Lines 02 k Canoot-Tyrer Data Fig.3 nd D ADaM.a om)of the n I line.b,Nur ed for a fixed num pletion s ring the g ng the ge tha e deple ber of th of ca a gene sh c)for all ed asac e ype.Number of genes predicted toRESEARCH Article Extended Data Fig. 3 | Computation of ovary-specific and pan-cancer core fitness genes with ADaM, and a summary of context-specific and core fitness genes. a, Number of fitness genes in each cell line. b, Number of fitness genes in a fixed number (m) of cell lines. c, Distributions and cumulative distributions of number of fitness genes observed in m cell lines across 1,000 randomized versions of the depletion scores for ovary cell lines. d, True-positive rates (for which a priori known essential genes are counted as positive) when considering the genes that are depleted (fitness genes) in at least m cell lines (blue curve) as predictions and the deviance of the number of these genes from expectations (computed using the randomized data shown in c) for all possible values of m (red curve). The x coordinate (rounded by excess) of the intersection of these two curves estimates the minimal number of cell lines m∗ in which a gene should be significantly depleted in order to be predicted as a core fitness gene for a cancer type. e, Number of genes predicted to be cancertype-specific core fitness genes for a fixed number (k) of cancer types. f, Distributions (top) and cumulative distributions (bottom) of the number of core fitness genes predicted for a fixed number of tissue types for 1,000 randomized versions of the cancer-type-specific core fitness profiles. g, True-positive rates (for which a priori known essential genes are counted as positive) when considering the genes that are core fitness genes for at least k cancer types (blue curve) as predictions and the deviance of the number of these genes from expectation (computed using the randomized data shown in f; red curve). The x coordinate estimates the minimal number of cancer types k∗ for which a gene should have been predicted as a cancer-type-specific core fitness gene in order to be classified as a pan-cancer core fitness gene. All box-and-whisker plots show the interquartile ranges and 95th percentiles, with centres indicating medians