正在加载图片...
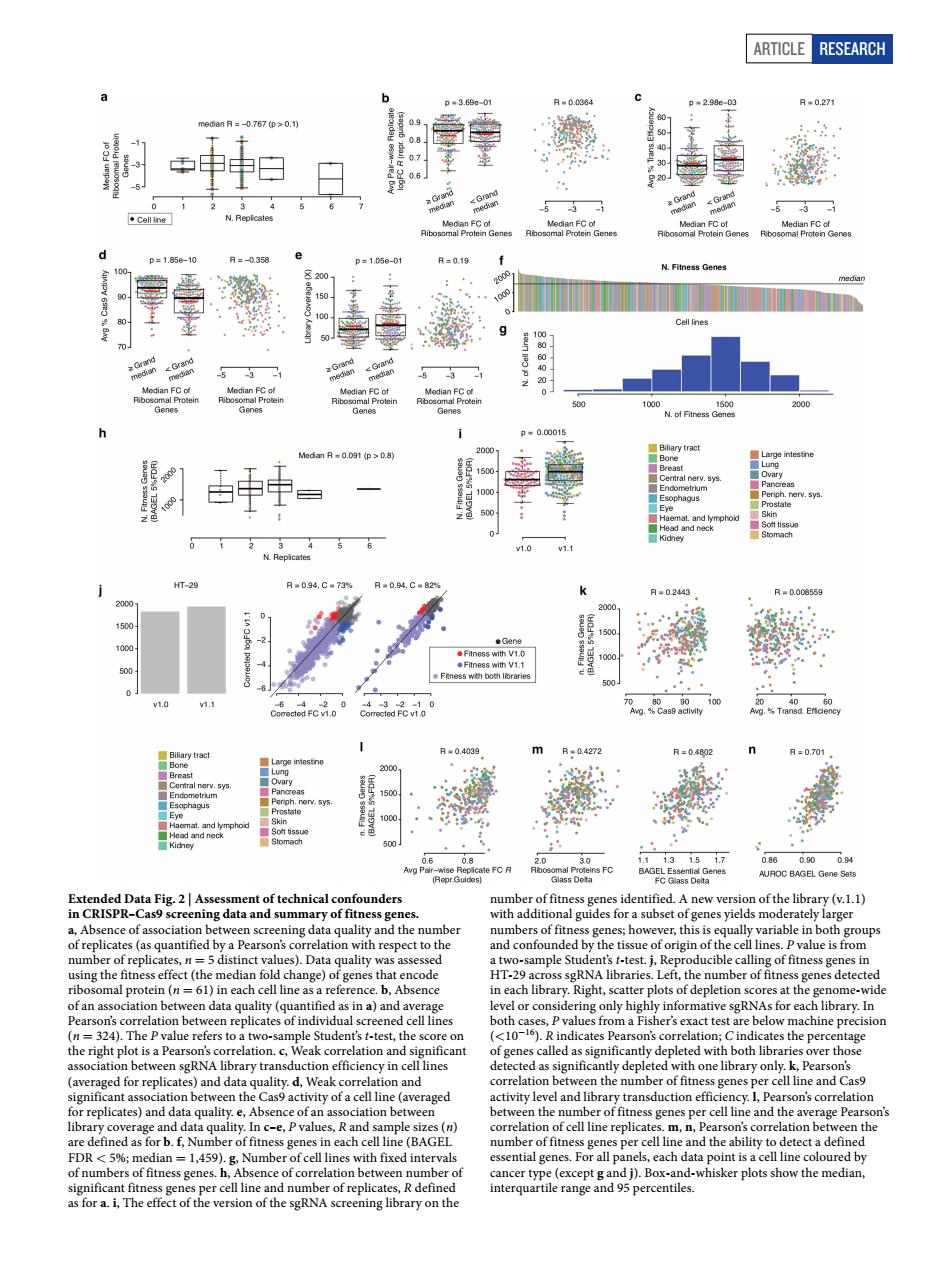
ARTICLE RESEARCH 刺评日日静季 an FC ct anFC 0. 警月 . 中= 目帝峰 是昌 屋屋明嚼海矮 RISPR-C49 t's ttest eted with on cell line and th as for b f Numbero ch cell line (BAge e and the ability t 。6 Article RESEARCH Extended Data Fig. 2 | Assessment of technical confounders in CRISPR–Cas9 screening data and summary of fitness genes. a, Absence of association between screening data quality and the number of replicates (as quantified by a Pearson’s correlation with respect to the number of replicates, n = 5 distinct values). Data quality was assessed using the fitness effect (the median fold change) of genes that encode ribosomal protein (n = 61) in each cell line as a reference. b, Absence of an association between data quality (quantified as in a) and average Pearson’s correlation between replicates of individual screened cell lines (n = 324). The P value refers to a two-sample Student’s t-test, the score on the right plot is a Pearson’s correlation. c, Weak correlation and significant association between sgRNA library transduction efficiency in cell lines (averaged for replicates) and data quality. d, Weak correlation and significant association between the Cas9 activity of a cell line (averaged for replicates) and data quality. e, Absence of an association between library coverage and data quality. In c–e, P values, R and sample sizes (n) are defined as for b. f, Number of fitness genes in each cell line (BAGEL FDR < 5%; median = 1,459). g, Number of cell lines with fixed intervals of numbers of fitness genes. h, Absence of correlation between number of significant fitness genes per cell line and number of replicates, R defined as for a. i, The effect of the version of the sgRNA screening library on the number of fitness genes identified. A new version of the library (v.1.1) with additional guides for a subset of genes yields moderately larger numbers of fitness genes; however, this is equally variable in both groups and confounded by the tissue of origin of the cell lines. P value is from a two-sample Student’s t-test. j, Reproducible calling of fitness genes in HT-29 across sgRNA libraries. Left, the number of fitness genes detected in each library. Right, scatter plots of depletion scores at the genome-wide level or considering only highly informative sgRNAs for each library. In both cases, P values from a Fisher’s exact test are below machine precision (<10−16). R indicates Pearson’s correlation; C indicates the percentage of genes called as significantly depleted with both libraries over those detected as significantly depleted with one library only. k, Pearson’s correlation between the number of fitness genes per cell line and Cas9 activity level and library transduction efficiency. l, Pearson’s correlation between the number of fitness genes per cell line and the average Pearson’s correlation of cell line replicates. m, n, Pearson’s correlation between the number of fitness genes per cell line and the ability to detect a defined essential genes. For all panels, each data point is a cell line coloured by cancer type (except g and j). Box-and-whisker plots show the median, interquartile range and 95 percentiles