正在加载图片...
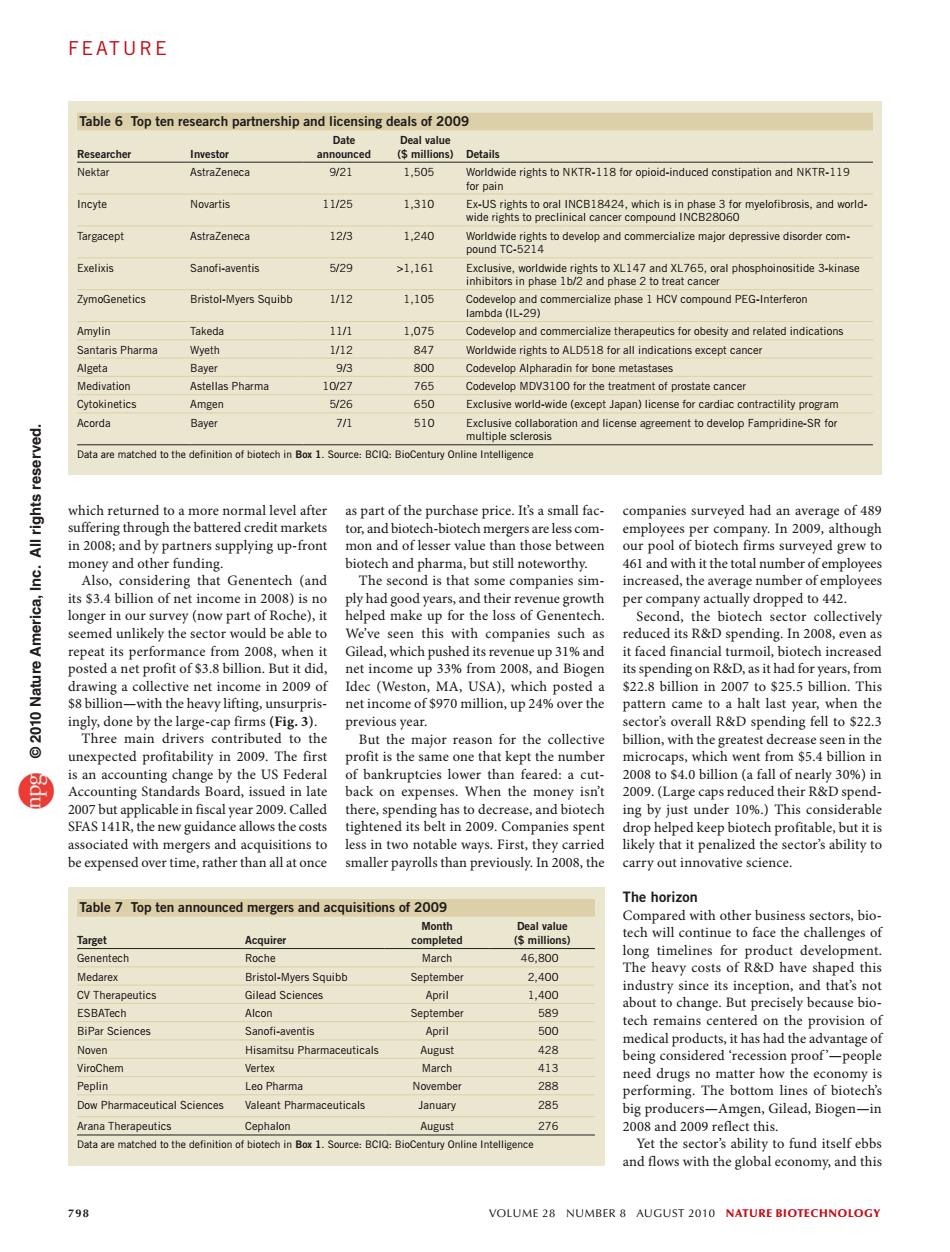
FEATURE Table 6 Top ten research partnership and licensing deals of 2009 Date Deal value Researcher Investor announced (millions) Details Nektar AstraZeneca 9/21 1.505 Worldwide rights to NKTR-118 for opioid-induced constipation and NKTR-119 for pain Incyte Novartis 11/25 1,310 Ex-US rights to oral INCB18424,which is in phase 3 for myelofibrosis,and world- wide rights to preclinical cancer compound INCB28060 Targacept AstraZeneca 123 1.240 Worldwide rights to develop and commercialize major depressive disorder com- pound TC-5214 Exelixis Sanofi-aventis 5/29 >1.161 Exclusive,worldwide rights to XL147 and XL765,oral phosphoinositide 3-kinase inhibitors in phase 1b/2 and phase 2 to treat cancer ZymoGenetics Bristol-Myers Squibb 1/12 1,105 Codevelop and commercialize phase 1 HCV compound PEG-Interferon lambda (IL-29) Amylin Takeda 11/1 1.075 Codevelop and commercialize therapeutics for obesity and related indications Santaris Pharma Wyeth 1/12 847 Worldwide rights to ALD518 for all indications except cancer Algeta Bayer 9/3 800 Codevelop Alpharadin for bone metastases Medivation Astellas Pharma 10/27 765 Codevelop MDV3100 for the treatment of prostate cancer Cytokinetics Amgen 5/26 650 Exclusive world-wide (except Japan)license for cardiac contractility program Acorda Bayer 71 510 Exclusive collaboration and license agreement to develop Fampridine-SR for multiple sclerosis Data are matched to the definition of biotech in Box 1.Source:BCIQ:BioCentury Online Intelligence which returned to a more normal level after as part of the purchase price.It's a small fac- companies surveyed had an average of 489 suffering through the battered credit markets tor,and biotech-biotech mergers are less com- employees per company.In 2009,although in 2008;and by partners supplying up-front mon and of lesser value than those between our pool of biotech firms surveyed grew to money and other funding. biotech and pharma,but still noteworthy. 461 and with it the total number of employees Also,considering that Genentech (and The second is that some companies sim- increased,the average number of employees its $3.4 billion of net income in 2008)is no ply had good years,and their revenue growth per company actually dropped to 442. longer in our survey (now part of Roche),it helped make up for the loss of Genentech. Second,the biotech sector collectively seemed unlikely the sector would be able to We've seen this with companies such as reduced its R&D spending.In 2008,even as repeat its performance from 2008,when it Gilead,which pushed its revenue up 31%and it faced financial turmoil,biotech increased posted a net profit of $3.8 billion.But it did, net income up 33%from 2008,and Biogen its spending on R&D,as it had for years,from drawing a collective net income in 2009 of Idec (Weston,MA,USA),which posted a $22.8 billion in 2007 to $25.5 billion.This $8 billion-with the heavy lifting,unsurpris- net income of $970 million,up 24%over the pattern came to a halt last year,when the 2100 ingly,done by the large-cap firms(Fig.3). previous year. sector's overall R&D spending fell to $22.3 Three main drivers contributed to the But the major reason for the collective billion,with the greatest decrease seen in the unexpected profitability in 2009.The first profit is the same one that kept the number microcaps,which went from $5.4 billion in is an accounting change by the US Federal of bankruptcies lower than feared:a cut- 2008 to $4.0 billion (a fall of nearly 30%)in Accounting Standards Board,issued in late back on expenses.When the money isn't 2009.(Large caps reduced their R&D spend- 2007 but applicable in fiscal year 2009.Called there,spending has to decrease,and biotech ing by just under 10%.)This considerable SFAS 141R,the new guidance allows the costs tightened its belt in 2009.Companies spent drop helped keep biotech profitable,but it is associated with mergers and acquisitions to less in two notable ways.First,they carried likely that it penalized the sector's ability to be expensed over time,rather than all at once smaller payrolls than previously.In 2008,the carry out innovative science. The horizon Table 7 Top ten announced mergers and acquisitions of 2009 Compared with other business sectors,bio- Month Deal value Target Acquirer completed (millions) tech will continue to face the challenges of Genentech Roche March 46,800 long timelines for product development. Medarex Bristol-Myers Squibb The heavy costs of R&D have shaped this September 2.400 CV Therapeutics 1,400 industry since its inception,and that's not Gilead Sciences April about to change.But precisely because bio- ESBATech Alcon September 589 tech remains centered on the provision of BiPar Sciences Sanofi-aventis April 500 medical products,it has had the advantage of Noven Hisamitsu Pharmaceuticals August 428 being considered 'recession proof'-people ViroChem Vertex March 413 need drugs no matter how the economy is Peplin Leo Pharma November 288 performing.The bottom lines of biotech's Dow Pharmaceutical Sciences Valeant Pharmaceuticals January 285 big producers-Amgen,Gilead,Biogen-in Arana Therapeutics Cephalon August 276 2008 and 2009 reflect this. Data are matched to the definition of biotech in Box 1.Source:BCIQ:BioCentury Online Intelligence Yet the sector's ability to fund itself ebbs and flows with the global economy,and this 798 VOLUME 28 NUMBER 8 AUGUST 2010 NATURE BIOTECHNOLOGY798 volume 28 number 8 august 2010 nature biotechnology companies surveyed had an average of 489 employees per company. In 2009, although our pool of biotech firms surveyed grew to 461 and with it the total number of employees increased, the average number of employees per company actually dropped to 442. Second, the biotech sector collectively reduced its R&D spending. In 2008, even as it faced financial turmoil, biotech increased its spending on R&D, as it had for years, from $22.8 billion in 2007 to $25.5 billion. This pattern came to a halt last year, when the sector’s overall R&D spending fell to $22.3 billion, with the greatest decrease seen in the microcaps, which went from $5.4 billion in 2008 to $4.0 billion (a fall of nearly 30%) in 2009. (Large caps reduced their R&D spending by just under 10%.) This considerable drop helped keep biotech profitable, but it is likely that it penalized the sector’s ability to carry out innovative science. The horizon Compared with other business sectors, biotech will continue to face the challenges of long timelines for product development. The heavy costs of R&D have shaped this industry since its inception, and that’s not about to change. But precisely because biotech remains centered on the provision of medical products, it has had the advantage of being considered ‘recession proof ’—people need drugs no matter how the economy is performing. The bottom lines of biotech’s big producers—Amgen, Gilead, Biogen—in 2008 and 2009 reflect this. Yet the sector’s ability to fund itself ebbs and flows with the global economy, and this as part of the purchase price. It’s a small factor, and biotech-biotech mergers are less common and of lesser value than those between biotech and pharma, but still noteworthy. The second is that some companies simply had good years, and their revenue growth helped make up for the loss of Genentech. We’ve seen this with companies such as Gilead, which pushed its revenue up 31% and net income up 33% from 2008, and Biogen Idec (Weston, MA, USA), which posted a net income of $970 million, up 24% over the previous year. But the major reason for the collective profit is the same one that kept the number of bankruptcies lower than feared: a cutback on expenses. When the money isn’t there, spending has to decrease, and biotech tightened its belt in 2009. Companies spent less in two notable ways. First, they carried smaller payrolls than previously. In 2008, the which returned to a more normal level after suffering through the battered credit markets in 2008; and by partners supplying up-front money and other funding. Also, considering that Genentech (and its $3.4 billion of net income in 2008) is no longer in our survey (now part of Roche), it seemed unlikely the sector would be able to repeat its performance from 2008, when it posted a net profit of $3.8 billion. But it did, drawing a collective net income in 2009 of $8 billion—with the heavy lifting, unsurprisingly, done by the large-cap firms (Fig. 3). Three main drivers contributed to the unexpected profitability in 2009. The first is an accounting change by the US Federal Accounting Standards Board, issued in late 2007 but applicable in fiscal year 2009. Called SFAS 141R, the new guidance allows the costs associated with mergers and acquisitions to be expensed over time, rather than all at once Table 7 Top ten announced mergers and acquisitions of 2009 Target Acquirer Month completed Deal value ($ millions) Genentech Roche March 46,800 Medarex Bristol-Myers Squibb September 2,400 CV Therapeutics Gilead Sciences April 1,400 ESBATech Alcon September 589 BiPar Sciences Sanofi-aventis April 500 Noven Hisamitsu Pharmaceuticals August 428 ViroChem Vertex March 413 Peplin Leo Pharma November 288 Dow Pharmaceutical Sciences Valeant Pharmaceuticals January 285 Arana Therapeutics Cephalon August 276 Data are matched to the definition of biotech in Box 1. Source: BCIQ: BioCentury Online Intelligence Table 6 Top ten research partnership and licensing deals of 2009 Researcher Investor Date announced Deal value ($ millions) Details Nektar AstraZeneca 9/21 1,505 Worldwide rights to NKTR-118 for opioid-induced constipation and NKTR-119 for pain Incyte Novartis 11/25 1,310 Ex-US rights to oral INCB18424, which is in phase 3 for myelofibrosis, and worldwide rights to preclinical cancer compound INCB28060 Targacept AstraZeneca 12/3 1,240 Worldwide rights to develop and commercialize major depressive disorder compound TC-5214 Exelixis Sanofi-aventis 5/29 >1,161 Exclusive, worldwide rights to XL147 and XL765, oral phosphoinositide 3-kinase inhibitors in phase 1b/2 and phase 2 to treat cancer ZymoGenetics Bristol-Myers Squibb 1/12 1,105 Codevelop and commercialize phase 1 HCV compound PEG-Interferon lambda (IL-29) Amylin Takeda 11/1 1,075 Codevelop and commercialize therapeutics for obesity and related indications Santaris Pharma Wyeth 1/12 847 Worldwide rights to ALD518 for all indications except cancer Algeta Bayer 9/3 800 Codevelop Alpharadin for bone metastases Medivation Astellas Pharma 10/27 765 Codevelop MDV3100 for the treatment of prostate cancer Cytokinetics Amgen 5/26 650 Exclusive world-wide (except Japan) license for cardiac contractility program Acorda Bayer 7/1 510 Exclusive collaboration and license agreement to develop Fampridine-SR for multiple sclerosis Data are matched to the definition of biotech in Box 1. Source: BCIQ: BioCentury Online Intelligence feat u re © 2010 Nature America, Inc. All rights reserved