正在加载图片...
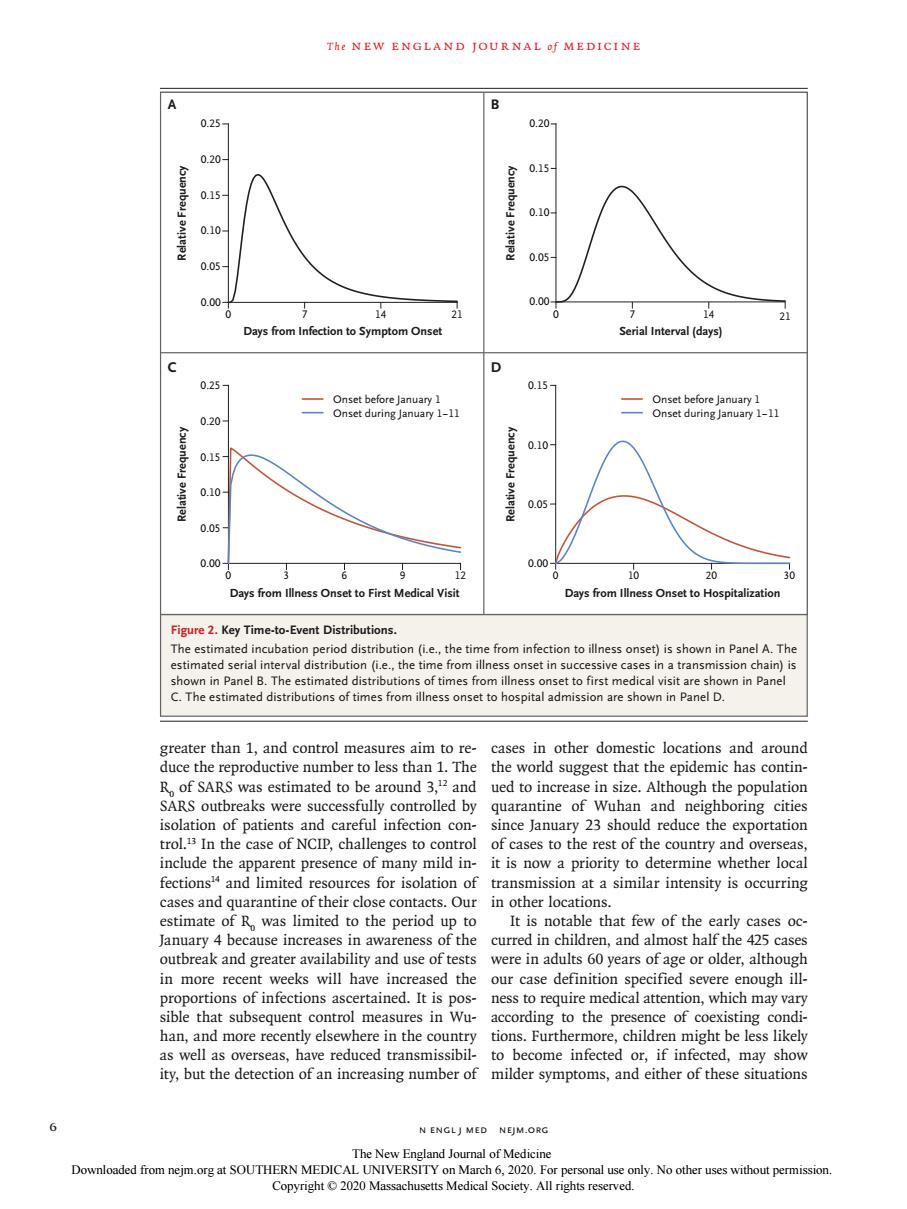
The NEW ENGLAND JOURNAL Of MEDICINE 025 020 015 .10 0.05 0.05 0.0 ys from Infection to s n Onse Serial er(days) D 025 二8 u1n 020 0.10 0.10 .0 .0 Days fro Onset to First M Days from lliness Onset to Hospitalizati Figure 2.Key Time-to-Event Distributions. The estimated incubation d distribution(e.the time from infection toness onset)is shown in Panel A.Th own in Panel B. The est aeddetrbUtio s of time The estimated distributions of times from illness onset toh greater than 1, and contro to less e wo ued to ntin of Wuh citie isolation of patients and careful infection con since lanuary 23 should reduce the exportation trol.In the case of NCIP,challenges to control of cases to the rest of the country and overseas include the apparent presence of many mild in- it is now a priority to determine whether loca fections and limited d resources for isolation of transmi ssion at a similar intensity is occurring cases and qua their clo se con in other lod R was limitec the period that few of the outbreak and greater availability and use of tests were in adults 60 years of age or older,altho in more recent weeks will have increased the our case definition specified severe enough ill proportions of infections ascertained.It is pos ness to require medical attention,which may vary sible that subsequent control measures in Wu according to the pres nce of coexisting cond han, tions.Furthermore, child night be less lik e ransm come inrectec nte of the may shov N ENGLJ MED NEJM.ORG The New Eng land Joural of Medicine Downloaded from nejm.ogat SOUTHERN ME 6 n engl j med nejm.org The new england journal o f medicine greater than 1, and control measures aim to reduce the reproductive number to less than 1. The R0 of SARS was estimated to be around 3,12 and SARS outbreaks were successfully controlled by isolation of patients and careful infection control.13 In the case of NCIP, challenges to control include the apparent presence of many mild infections14 and limited resources for isolation of cases and quarantine of their close contacts. Our estimate of R0 was limited to the period up to January 4 because increases in awareness of the outbreak and greater availability and use of tests in more recent weeks will have increased the proportions of infections ascertained. It is possible that subsequent control measures in Wuhan, and more recently elsewhere in the country as well as overseas, have reduced transmissibility, but the detection of an increasing number of cases in other domestic locations and around the world suggest that the epidemic has continued to increase in size. Although the population quarantine of Wuhan and neighboring cities since January 23 should reduce the exportation of cases to the rest of the country and overseas, it is now a priority to determine whether local transmission at a similar intensity is occurring in other locations. It is notable that few of the early cases occurred in children, and almost half the 425 cases were in adults 60 years of age or older, although our case definition specified severe enough illness to require medical attention, which may vary according to the presence of coexisting conditions. Furthermore, children might be less likely to become infected or, if infected, may show milder symptoms, and either of these situations Figure 2. Key Time-to-Event Distributions. The estimated incubation period distribution (i.e., the time from infection to illness onset) is shown in Panel A. The estimated serial interval distribution (i.e., the time from illness onset in successive cases in a transmission chain) is shown in Panel B. The estimated distributions of times from illness onset to first medical visit are shown in Panel C. The estimated distributions of times from illness onset to hospital admission are shown in Panel D. A 0 7 14 21 0.00 0.05 0.10 0.25 0.20 0.15 Days from Infection to Symptom Onset B 0 7 14 21 0.00 0.05 0.10 0.20 0.15 Serial Interval (days) 0 3 6 9 12 0.00 0.05 0.10 0.15 0.20 0.25 Days from Illness Onset to First Medical Visit Onset before January 1 Onset during January 1−11 C 0 10 20 30 0.00 0.05 0.10 0.15 Days from Illness Onset to Hospitalization Relative Frequency Relative Frequency Relative Frequency Relative Frequency D Onset before January 1 Onset during January 1−11 The New England Journal of Medicine Downloaded from nejm.org at SOUTHERN MEDICAL UNIVERSITY on March 6, 2020. For personal use only. No other uses without permission. Copyright © 2020 Massachusetts Medical Society. All rights reserved