正在加载图片...
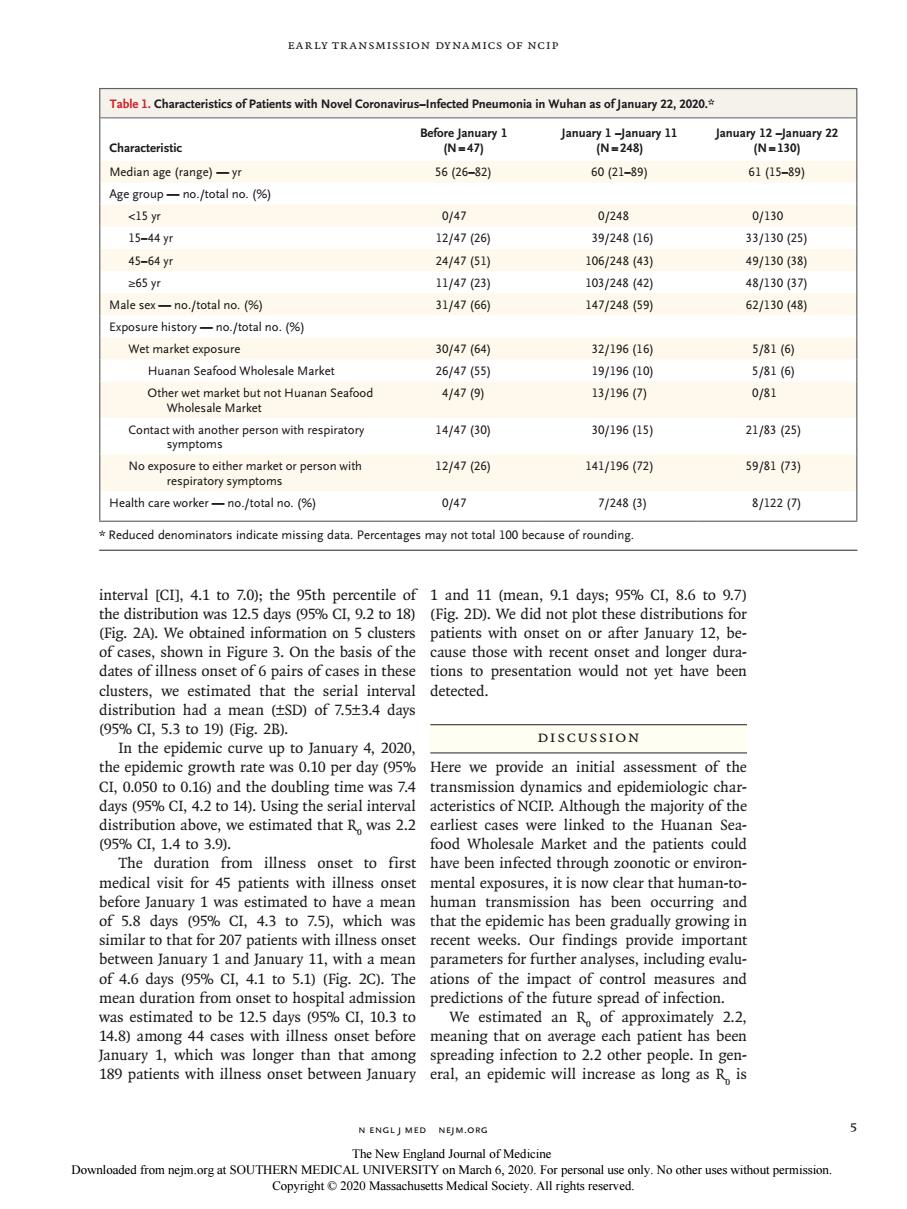
EARLY TRANSMISSION DYNAMICS OF NCIP Table .Characteristics of Patients with Novel Co onavirus-nfected Pneumonia in Wuhanas of. Characteristi Median age(range)一yt 56(26-82 60(21-39 61(15-89) Age group-no./total no.(9) c15vt 0/47 0248 0130 15-44yT 27间 39/248(16 33130(25) 45-64y 24/47(51 106/24843 49/130(38) ≥65y7 11/47(23) 103/248(42 48/130(37 Male sex- -no./total no.(9) 31/47(66 147/248(59 62/130(48 Exposure history-no./total no.(% Wet market exposure 30/4764) 32/19616 581(6 Huanan seafood wholesale marke 26/47(55 19/19610 5/81(同间 Othe 3/196( 14/47(30) 30/196(15) 21/83(25 12147(2 141/n96(72 5981(73到 Health care worker-no./total no.(% 0/47 7/248(3) 8/122(0 Reduced denominators indicate missing data.Percentages may not total 100 because of rounding. interval [CI],4.1 to 7.0);the 95th percentile of 1 and 11 (mean,9.1 days;95%CI,8.6 to 9.7) the distribution was 12.5 days(%CL,9.2 to 18)(Fig.2D).We did not plot these distributions for (Fig.2A).We obtained information on 5 clusters patients with onset on or after January 12,be- onse in thes that distribution had a mean SD)of 53.4 days 95%CL,5.3to19Fig2B). In the epidemic curve up to January 4,2020 DISCUSSION the epidemic growth rate was 0.10 per day(%Here we provide an initial assessment of the CI,0.050 to 0.16)and the doubling time was 7.4 2t014.0s ing the h ugh jority or th and th The duration from illness onset to first have been infected through zoonotic or environ- medical visit for 45 patients with illness onset mental exposures,it is now clear that human-to- before January 1 was estimated to have a mean human transmission has been occurring and of 5.8 days (9%Cl,4.3 to 7.5),which was that the epidemic has been graduall ly growing in similar to that fo patients w ss onset recent wee Our findings provid rther a includ mg eva ys diction of to h cod of infe was estimated to be 12.5 days (9%CI.10.3 to We estimated an R of approximately 2.2. 14.8)among 44 cases with illness onset before meaning that on average each patient has been January 1,which w spreading infection to 2.2 other people.In gen- N ENGLIMED NEIM.ORO 5 nal usn engl j med nejm.org 5 Early Transmission Dynamics of NCIP interval [CI], 4.1 to 7.0); the 95th percentile of the distribution was 12.5 days (95% CI, 9.2 to 18) (Fig. 2A). We obtained information on 5 clusters of cases, shown in Figure 3. On the basis of the dates of illness onset of 6 pairs of cases in these clusters, we estimated that the serial interval distribution had a mean (±SD) of 7.5±3.4 days (95% CI, 5.3 to 19) (Fig. 2B). In the epidemic curve up to January 4, 2020, the epidemic growth rate was 0.10 per day (95% CI, 0.050 to 0.16) and the doubling time was 7.4 days (95% CI, 4.2 to 14). Using the serial interval distribution above, we estimated that R0 was 2.2 (95% CI, 1.4 to 3.9). The duration from illness onset to first medical visit for 45 patients with illness onset before January 1 was estimated to have a mean of 5.8 days (95% CI, 4.3 to 7.5), which was similar to that for 207 patients with illness onset between January 1 and January 11, with a mean of 4.6 days (95% CI, 4.1 to 5.1) (Fig. 2C). The mean duration from onset to hospital admission was estimated to be 12.5 days (95% CI, 10.3 to 14.8) among 44 cases with illness onset before January 1, which was longer than that among 189 patients with illness onset between January 1 and 11 (mean, 9.1 days; 95% CI, 8.6 to 9.7) (Fig. 2D). We did not plot these distributions for patients with onset on or after January 12, because those with recent onset and longer durations to presentation would not yet have been detected. Discussion Here we provide an initial assessment of the transmission dynamics and epidemiologic characteristics of NCIP. Although the majority of the earliest cases were linked to the Huanan Seafood Wholesale Market and the patients could have been infected through zoonotic or environmental exposures, it is now clear that human-tohuman transmission has been occurring and that the epidemic has been gradually growing in recent weeks. Our findings provide important parameters for further analyses, including evaluations of the impact of control measures and predictions of the future spread of infection. We estimated an R0 of approximately 2.2, meaning that on average each patient has been spreading infection to 2.2 other people. In general, an epidemic will increase as long as R0 is Characteristic Before January 1 (N=47) January 1 –January 11 (N=248) January 12 –January 22 (N=130) Median age (range) — yr 56 (26–82) 60 (21–89) 61 (15–89) Age group — no./total no. (%) <15 yr 0/47 0/248 0/130 15–44 yr 12/47 (26) 39/248 (16) 33/130 (25) 45–64 yr 24/47 (51) 106/248 (43) 49/130 (38) ≥65 yr 11/47 (23) 103/248 (42) 48/130 (37) Male sex — no./total no. (%) 31/47 (66) 147/248 (59) 62/130 (48) Exposure history — no./total no. (%) Wet market exposure 30/47 (64) 32/196 (16) 5/81 (6) Huanan Seafood Wholesale Market 26/47 (55) 19/196 (10) 5/81 (6) Other wet market but not Huanan Seafood Wholesale Market 4/47 (9) 13/196 (7) 0/81 Contact with another person with respiratory symptoms 14/47 (30) 30/196 (15) 21/83 (25) No exposure to either market or person with respiratory symptoms 12/47 (26) 141/196 (72) 59/81 (73) Health care worker — no./total no. (%) 0/47 7/248 (3) 8/122 (7) * Reduced denominators indicate missing data. Percentages may not total 100 because of rounding. Table 1. Characteristics of Patients with Novel Coronavirus–Infected Pneumonia in Wuhan as of January 22, 2020.* The New England Journal of Medicine Downloaded from nejm.org at SOUTHERN MEDICAL UNIVERSITY on March 6, 2020. For personal use only. No other uses without permission. Copyright © 2020 Massachusetts Medical Society. All rights reserved