正在加载图片...
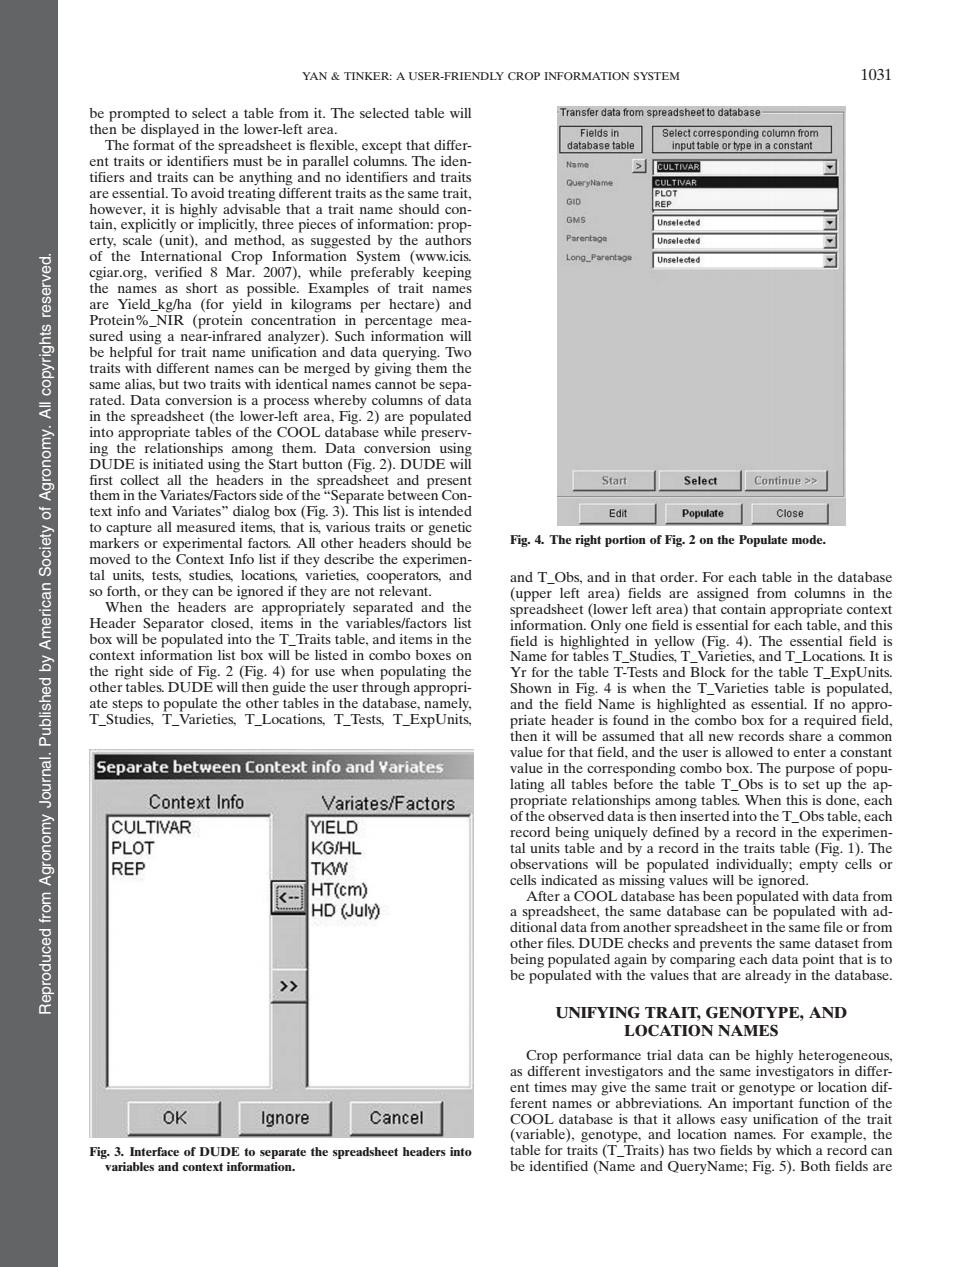
YAN TINKER:A USER-FRIENDLY CROP INFORMATION SYSTEM 1031 se tab aralle t).and in xampl of trait na be help nam a 2DE Start Select Continue > arat that Edit Popttate Close ts Fig.4.The right portion of Figon the Populate mode ext Info list f the tbe the they are not rel that He e listed in side for ag es T h appr n in 4 is whts an ead er is found in the bo box for Separate between Context info and variates d to nter a ating all tables be ore the tabl Context Info Varates/Factors ong tab is the CULTIVAR YIELD bs table.ca PLOT KG/HL by a re REP TKW HT(cm) ng value empty HD (July the s DUDE che 长ace int that is to UNIFYING TRAIT,GENOTYPE,AND LOCATION NAMES no Cancel casy unific tionof the gen s two fields by wh ueryName:Fig5).Both ebe prompted to select a table from it. The selected table will then be displayed in the lower-left area. The format of the spreadsheet is flexible, except that different traits or identifiers must be in parallel columns. The identifiers and traits can be anything and no identifiers and traits are essential. To avoid treating different traits as the same trait, however, it is highly advisable that a trait name should contain, explicitly or implicitly, three pieces of information: property, scale (unit), and method, as suggested by the authors of the International Crop Information System (www.icis. cgiar.org, verified 8 Mar. 2007), while preferably keeping the names as short as possible. Examples of trait names are Yield_kg/ha (for yield in kilograms per hectare) and Protein%_NIR (protein concentration in percentage measured using a near-infrared analyzer). Such information will be helpful for trait name unification and data querying. Two traits with different names can be merged by giving them the same alias, but two traits with identical names cannot be separated. Data conversion is a process whereby columns of data in the spreadsheet (the lower-left area, Fig. 2) are populated into appropriate tables of the COOL database while preserving the relationships among them. Data conversion using DUDE is initiated using the Start button (Fig. 2). DUDE will first collect all the headers in the spreadsheet and present them in the Variates/Factors side of the “Separate between Context info and Variates” dialog box (Fig. 3). This list is intended to capture all measured items, that is, various traits or genetic markers or experimental factors. All other headers should be moved to the Context Info list if they describe the experimental units, tests, studies, locations, varieties, cooperators, and so forth, or they can be ignored if they are not relevant. When the headers are appropriately separated and the Header Separator closed, items in the variables/factors list box will be populated into the T_Traits table, and items in the context information list box will be listed in combo boxes on the right side of Fig. 2 (Fig. 4) for use when populating the other tables. DUDE will then guide the user through appropriate steps to populate the other tables in the database, namely, T_Studies, T_Varieties, T_Locations, T_Tests, T_ExpUnits, and T_Obs, and in that order. For each table in the database (upper left area) fields are assigned from columns in the spreadsheet (lower left area) that contain appropriate context information. Only one field is essential for each table, and this field is highlighted in yellow (Fig. 4). The essential field is Name for tables T_Studies, T_Varieties, and T_Locations. It is Yr for the table T-Tests and Block for the table T_ExpUnits. Shown in Fig. 4 is when the T_Varieties table is populated, and the field Name is highlighted as essential. If no appropriate header is found in the combo box for a required field, then it will be assumed that all new records share a common value for that field, and the user is allowed to enter a constant value in the corresponding combo box. The purpose of populating all tables before the table T_Obs is to set up the appropriate relationships among tables. When this is done, each of the observed data is then inserted into the T_Obs table, each record being uniquely defined by a record in the experimental units table and by a record in the traits table (Fig. 1). The observations will be populated individually; empty cells or cells indicated as missing values will be ignored. After a COOL database has been populated with data from a spreadsheet, the same database can be populated with additional data from another spreadsheet in the same file or from other files. DUDE checks and prevents the same dataset from being populated again by comparing each data point that is to be populated with the values that are already in the database. UNIFYING TRAIT, GENOTYPE, AND LOCATION NAMES Crop performance trial data can be highly heterogeneous, as different investigators and the same investigators in different times may give the same trait or genotype or location different names or abbreviations. An important function of the COOL database is that it allows easy unification of the trait (variable), genotype, and location names. For example, the table for traits (T_Traits) has two fields by which a record can be identified (Name and QueryName; Fig. 5). Both fields are Fig. 3. Interface of DUDE to separate the spreadsheet headers into variables and context information. Fig. 4. The right portion of Fig. 2 on the Populate mode. Reproduced from Agronomy Journal. Published by American Society of Agronomy. All copyrights reserved. YAN & TINKER: A USER-FRIENDLY CROP INFORMATION SYSTEM 1031