正在加载图片...
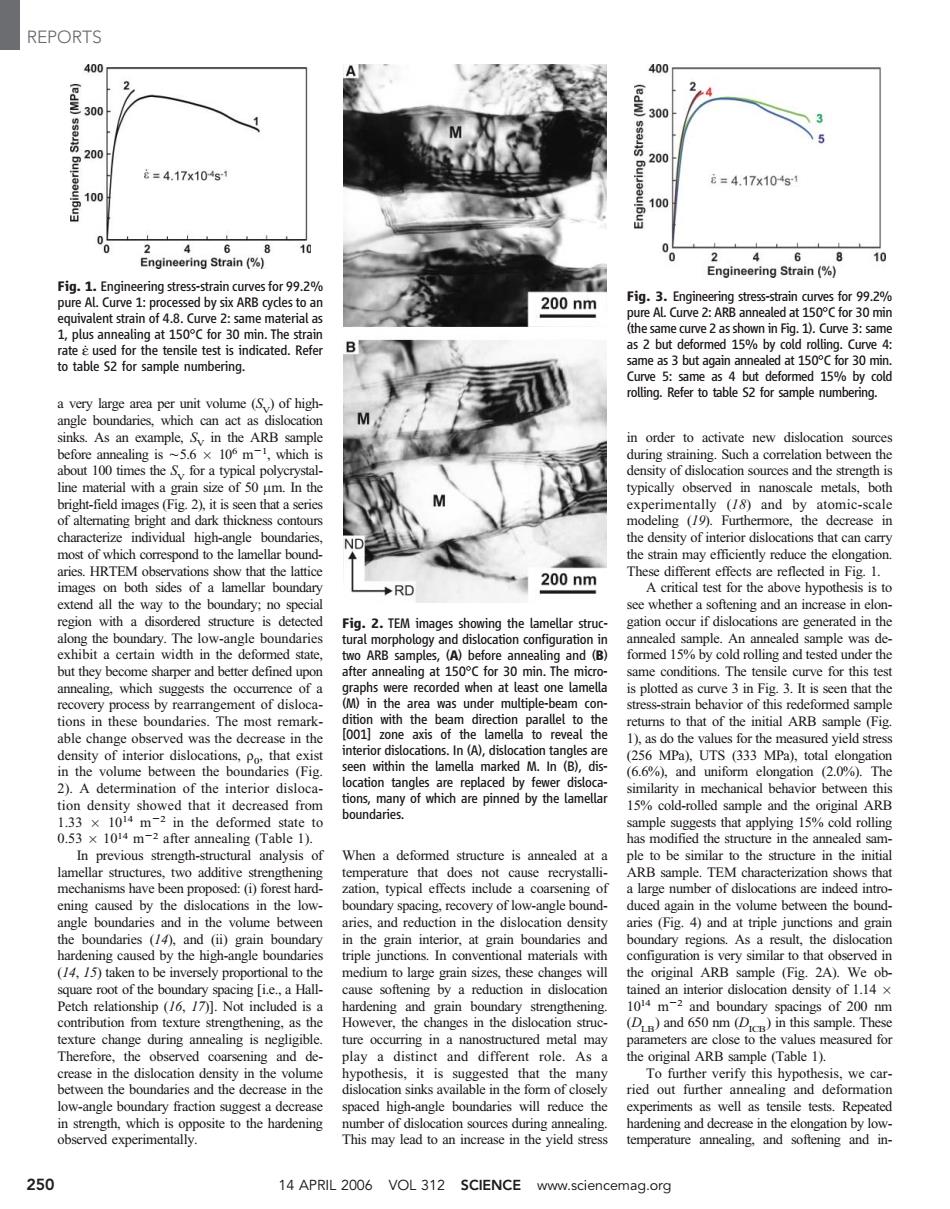
REPORTS 400 400 (edW) 300 3 200 200 c=4.17x10s1 元=4.17x10⁴s1 100 0 2 46 8 10 Engineering Strain(%) 0 2 4 6 8 10 Engineering Strain(%) Fig.1.Engineering stress-strain curves for 99.2% pure AL.Curve 1:processed by six ARB cycles to an 200nm Fig.3.Engineering stress-strain curves for 99.2% equivalent strain of 4.8.Curve 2:same material as pure AL.Curve 2:ARB annealed at 150C for 30 min 1,plus annealing at 150C for 30 min.The strain (the same curve 2 as shown in Fig.1).Curve 3:same rate used for the tensile test is indicated.Refer as 2 but deformed 15%by cold rolling.Curve 4: to table S2 for sample numbering. same as 3 but again annealed at 150C for 30 min. Curve 5:same as 4 but deformed 15%by cold rolling.Refer to table S2 for sample numbering. a very large area per unit volume (S)of high- angle boundaries,which can act as dislocation sinks.As an example,S,in the ARB sample in order to activate new dislocation sources before annealing is ~5.6 x 10⁶ m-,which is during straining.Such a correlation between the about 100 times the for a typical polycrystal- density of dislocation sources and the strength is line material with a grain size of 50 um.In the typically observed in nanoscale metals,both bright-field images(Fig.2),it is seen that a series M experimentally (18)and by atomic-scale of alterating bright and dark thickness contours modeling (/9).Furthermore,the decrease in characterize individual high-angle boundaries. the density of interior dislocations that can carry most of which correspond to the lamellar bound- the strain may efficiently reduce the elongation. aries.HRTEM observations show that the lattice images on both sides of a lamellar boundary 200nm These different effects are reflected in Fig.1. RD A critical test for the above hypothesis is to extend all the way to the boundary:no special see whether a softening and an increase in elon- region with a disordered structure is detected Fig.2.TEM images showing the lamellar struc- gation occur if dislocations are generated in the along the boundary.The low-angle boundaries tural morphology and dislocation configuration in annealed sample.An annealed sample was de- exhibit a certain width in the deformed state. two ARB samples,(A)before annealing and (B) formed 15%by cold rolling and tested under the but they become sharper and better defined upon after annealing at 150C for 30 min.The micro- same conditions.The tensile curve for this test annealing,which suggests the occurrence of a graphs were recorded when at least one lamella is plotted as curve 3 in Fig.3.It is seen that the recovery process by rearrangement of disloca- (M)in the area was under multiple-beam con- stress-strain behavior of this redeformed sample tions in these boundaries.The most remark- dition with the beam direction parallel to the returns to that of the initial ARB sample(Fig able change observed was the decrease in the [001]zone axis of the lamella to reveal the 1),as do the values for the measured yield stress density of interior dislocations,Po that exist interior dislocations.In (A),dislocation tangles are (256 MPa),UTS (333 MPa),total elongation in the volume between the boundaries (Fig. seen within the lamella marked M.In (B),dis- (6.6%).and uniform elongation (2.0%).The 2).A determination of the interior disloca- location tangles are replaced by fewer disloca- similarity in mechanical behavior between this tion density showed that it decreased from tions,many of which are pinned by the lamellar 15%cold-rolled sample and the original ARB 1.33 x 10¹⁴ m-2 in the deformed state to boundaries. sample suggests that applying 15%cold rolling 0.53 x 10¹⁴ m-2 after annealing (Table 1). has modified the structure in the annealed sam In previous strength-structural analysis of When a deformed structure is annealed at a ple to be similar to the structure in the initial lamellar structures,two additive strengthening temperature that does not cause recrystalli- ARB sample.TEM characterization shows that mechanisms have been proposed:(i)forest hard- zation,typical effects include a coarsening of a large number of dislocations are indeed intro- ening caused by the dislocations in the low- boundary spacing,recovery of low-angle bound- duced again in the volume between the bound- angle boundaries and in the volume between aries.and reduction in the dislocation density aries (Fig.4)and at triple junctions and grain the boundaries (/4),and (ii)grain boundary in the grain interior,at grain boundaries and boundary regions.As a result,the dislocation hardening caused by the high-angle boundaries triple junctions.In conventional materials with configuration is very similar to that observed in (14.15)taken to be inversely proportional to the medium to large grain sizes,these changes will the original ARB sample (Fig.2A).We ob- square root of the boundary spacing [i.e.,a Hall- cause softening by a reduction in dislocation tained an interior dislocation density of 1.14 x Petch relationship (/6,/7)].Not included is a hardening and grain boundary strengthening. 1014 m-2 and boundary spacings of 200 nm contribution from texture strengthening,as the However,the changes in the dislocation struc- (DB)and 650 nm (Dic)in this sample.These texture change during annealing is negligible. ture occurring in a nanostructured metal may parameters are close to the values measured for Therefore,the observed coarsening and de- play a distinct and different role.As a the original ARB sample (Table 1). crease in the dislocation density in the volume hypothesis,it is suggested that the many To further verify this hypothesis,we car- between the boundaries and the decrease in the dislocation sinks available in the form of closely ried out further annealing and deformation low-angle boundary fraction suggest a decrease spaced high-angle boundaries will reduce the experiments as well as tensile tests.Repeated in strength,which is opposite to the hardening number of dislocation sources during annealing. hardening and decrease in the elongation by low- observed experimentally. This may lead to an increase in the yield stress temperature annealing,and softening and in- 250 14 APRIL 2006 VOL 312 SCIENCE www.sciencemag.orga very large area per unit volume (SV) of highangle boundaries, which can act as dislocation sinks. As an example, SV in the ARB sample before annealing is È5.6 106 mj1 , which is about 100 times the SV for a typical polycrystalline material with a grain size of 50 mm. In the bright-field images (Fig. 2), it is seen that a series of alternating bright and dark thickness contours characterize individual high-angle boundaries, most of which correspond to the lamellar boundaries. HRTEM observations show that the lattice images on both sides of a lamellar boundary extend all the way to the boundary; no special region with a disordered structure is detected along the boundary. The low-angle boundaries exhibit a certain width in the deformed state, but they become sharper and better defined upon annealing, which suggests the occurrence of a recovery process by rearrangement of dislocations in these boundaries. The most remarkable change observed was the decrease in the density of interior dislocations, r0, that exist in the volume between the boundaries (Fig. 2). A determination of the interior dislocation density showed that it decreased from 1.33 1014 mj2 in the deformed state to 0.53 1014 mj2 after annealing (Table 1). In previous strength-structural analysis of lamellar structures, two additive strengthening mechanisms have been proposed: (i) forest hardening caused by the dislocations in the lowangle boundaries and in the volume between the boundaries (14), and (ii) grain boundary hardening caused by the high-angle boundaries (14, 15) taken to be inversely proportional to the square root of the boundary spacing Ei.e., a HallPetch relationship (16, 17)^. Not included is a contribution from texture strengthening, as the texture change during annealing is negligible. Therefore, the observed coarsening and decrease in the dislocation density in the volume between the boundaries and the decrease in the low-angle boundary fraction suggest a decrease in strength, which is opposite to the hardening observed experimentally. When a deformed structure is annealed at a temperature that does not cause recrystallization, typical effects include a coarsening of boundary spacing, recovery of low-angle boundaries, and reduction in the dislocation density in the grain interior, at grain boundaries and triple junctions. In conventional materials with medium to large grain sizes, these changes will cause softening by a reduction in dislocation hardening and grain boundary strengthening. However, the changes in the dislocation structure occurring in a nanostructured metal may play a distinct and different role. As a hypothesis, it is suggested that the many dislocation sinks available in the form of closely spaced high-angle boundaries will reduce the number of dislocation sources during annealing. This may lead to an increase in the yield stress in order to activate new dislocation sources during straining. Such a correlation between the density of dislocation sources and the strength is typically observed in nanoscale metals, both experimentally (18) and by atomic-scale modeling (19). Furthermore, the decrease in the density of interior dislocations that can carry the strain may efficiently reduce the elongation. These different effects are reflected in Fig. 1. A critical test for the above hypothesis is to see whether a softening and an increase in elongation occur if dislocations are generated in the annealed sample. An annealed sample was deformed 15% by cold rolling and tested under the same conditions. The tensile curve for this test is plotted as curve 3 in Fig. 3. It is seen that the stress-strain behavior of this redeformed sample returns to that of the initial ARB sample (Fig. 1), as do the values for the measured yield stress (256 MPa), UTS (333 MPa), total elongation (6.6%), and uniform elongation (2.0%). The similarity in mechanical behavior between this 15% cold-rolled sample and the original ARB sample suggests that applying 15% cold rolling has modified the structure in the annealed sample to be similar to the structure in the initial ARB sample. TEM characterization shows that a large number of dislocations are indeed introduced again in the volume between the boundaries (Fig. 4) and at triple junctions and grain boundary regions. As a result, the dislocation configuration is very similar to that observed in the original ARB sample (Fig. 2A). We obtained an interior dislocation density of 1.14 1014 mj2 and boundary spacings of 200 nm (DLB) and 650 nm (DICB) in this sample. These parameters are close to the values measured for the original ARB sample (Table 1). To further verify this hypothesis, we carried out further annealing and deformation experiments as well as tensile tests. Repeated hardening and decrease in the elongation by lowtemperature annealing, and softening and inFig. 3. Engineering stress-strain curves for 99.2% pure Al. Curve 2: ARB annealed at 150-C for 30 min (the same curve 2 as shown in Fig. 1). Curve 3: same as 2 but deformed 15% by cold rolling. Curve 4: same as 3 but again annealed at 150-C for 30 min. Curve 5: same as 4 but deformed 15% by cold rolling. Refer to table S2 for sample numbering. Fig. 2. TEM images showing the lamellar structural morphology and dislocation configuration in two ARB samples, (A) before annealing and (B) after annealing at 150-C for 30 min. The micrographs were recorded when at least one lamella (M) in the area was under multiple-beam condition with the beam direction parallel to the [001] zone axis of the lamella to reveal the interior dislocations. In (A), dislocation tangles are seen within the lamella marked M. In (B), dislocation tangles are replaced by fewer dislocations, many of which are pinned by the lamellar boundaries. Fig. 1. Engineering stress-strain curves for 99.2% pure Al. Curve 1: processed by six ARB cycles to an equivalent strain of 4.8. Curve 2: same material as 1, plus annealing at 150-C for 30 min. The strain rate e˙ used for the tensile test is indicated. Refer to table S2 for sample numbering. REPORTS 250 14 APRIL 2006 VOL 312 SCIENCE www.sciencemag.org