正在加载图片...

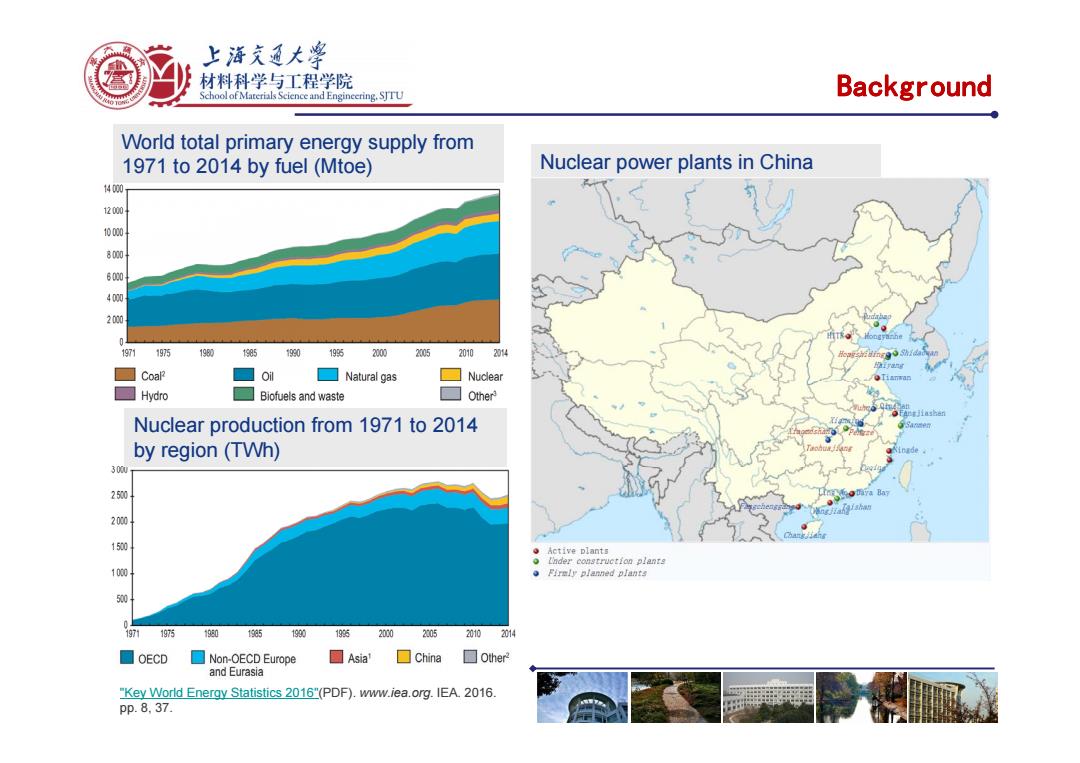
上游充通大学 材料科学与工程学院 School of Materials Science and Enginecring.SITU Background World total primary energy supply from 1971 to 2014 by fuel(Mtoe) Nuclear power plants in China 14000 1200 00 800 600 400 20 0 1971 1975 1980 1985 198019% 200 2305 2010204 ☐coan o ☐Natural gas ☐Nuclear Hydro ☐Biofuels and waste ☐Other3 Nuclear production from 1971 to 2014 by region(TWh) 30 250 20 150 Active plants Inder construction plants 100 Firmly planned plants 50 1971 19719011g90196200205 20102014 ■OECD ☐Non-OECD Europe ☐Asia'☐China ☐Other and Eurasia "Key World Energy Statistics 2016"(PDF).www.iea.org.IEA.2016. pp.8.37.Background World total primary energy supply from 1971 to 2014 by fuel (Mtoe) Nuclear power plants in China Nuclear production from 1971 to 2014 by region (TWh) "Key World Energy Statistics 2016"(PDF). www.iea.org. IEA. 2016. pp. 8, 37