正在加载图片...

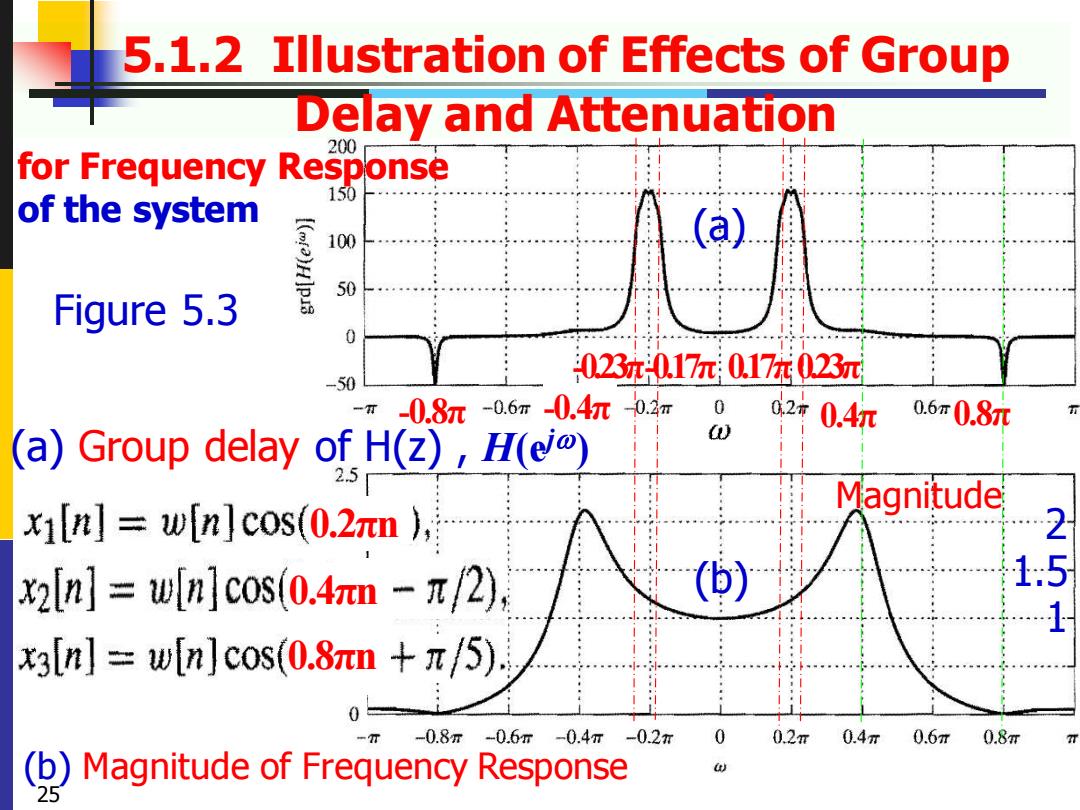
5.1.2 Illustration of Effects of Group Delay and Attenuation 200 for Frequency Response 150 of the system a [(a)H]p3 100 50 Figure 5.3 0 023π0.17m0.17π023π -50 -0.8m-0.6m-0.4r02m 02年0.4 0.6m0.8m (a)Group delay of H(z),H(ej) 2.5 Magnitude x][n]w[n]cos(0.2nn ) 2 x2[n]w[n]cos(0.4nn -/2) 1.5 x3[n]=w[n]cos(0.8πn+π/5) -0.8m-0.6π-0.4m-02r 0 0.2π 0.4r 0.6m 0.8π ()Magnitude of Frequency Response5.1.2 Illustration of Effects of Group Delay and Attenuation (a) Group delay of H(z) , H(e j ) (b) Magnitude of Frequency Response Figure 5.3 25 -0.23π-0.17π 0.17π0.23π 0.2πn 0.4πn 0.8πn -0.8π -0.4π 0.4π 0.8π 1 2 1.5 for Frequency Response of the system (a) (b) Magnitude