正在加载图片...
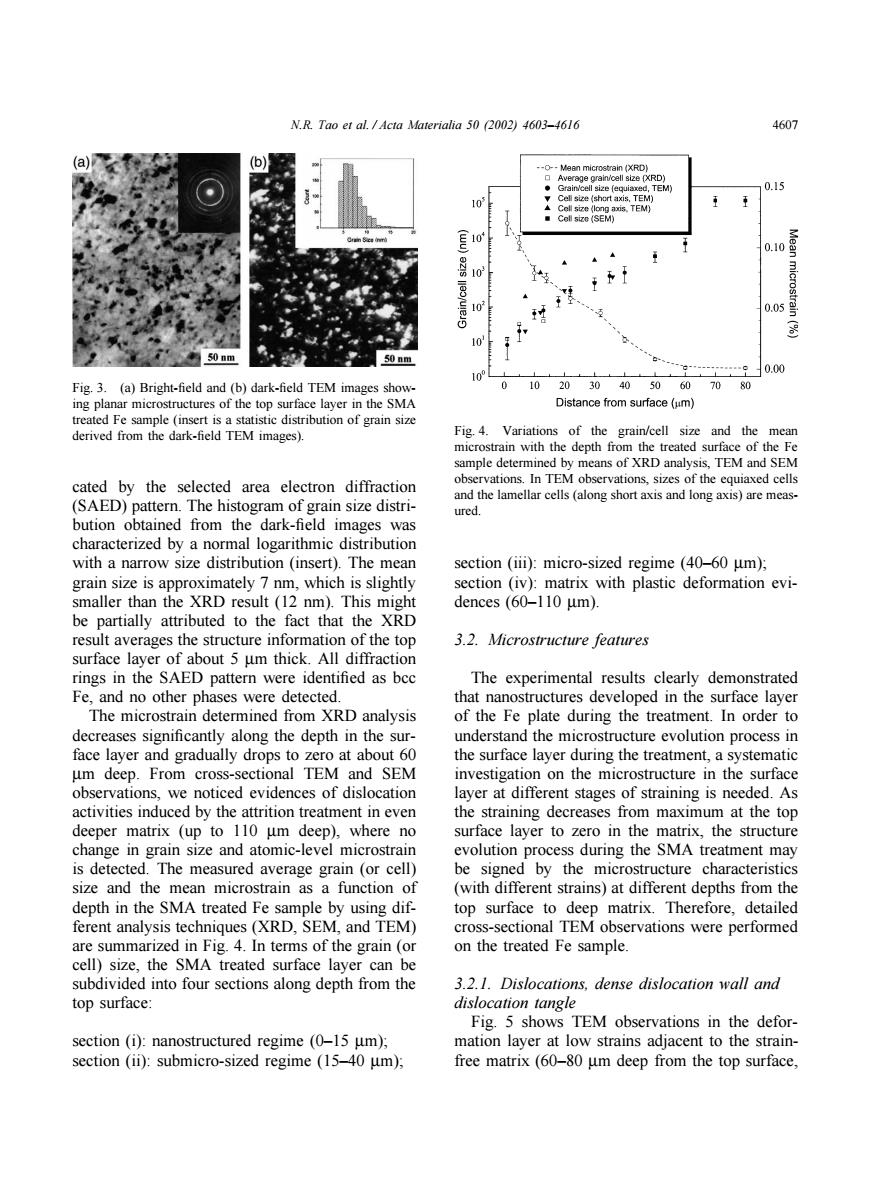
N.R.Tao et al.Acta Materialia 50 (2002)4603-4616 4607 (b Mean microstrain (XRD) Average grain/oell size [XRD) Grain/cell size (equiaxed,TEM) 0.15 Cell size (short axis.TEM) Ccl记(long axi成TEM) Coll sio (SEM) 0.10 10 102 0.05 microstrain 多 10 50 nm 50 nm 10 990.00 Fig.3.(a)Bright-field and (b)dark-field TEM images show- 10 20304050607080 ing planar microstructures of the top surface layer in the SMA Distance from surface (um) treated Fe sample (insert is a statistic distribution of grain size derived from the dark-field TEM images). Fig.4. Variations of the grain/cell size and the mean microstrain with the depth from the treated surface of the Fe sample determined by means of XRD analysis,TEM and SEM cated by the selected area electron diffraction observations.In TEM observations,sizes of the equiaxed cells (SAED)pattern.The histogram of grain size distri- and the lamellar cells(along short axis and long axis)are meas- ured. bution obtained from the dark-field images was characterized by a normal logarithmic distribution with a narrow size distribution (insert).The mean section (iii):micro-sized regime (40-60 um); grain size is approximately 7 nm,which is slightly section (iv):matrix with plastic deformation evi- smaller than the XRD result(12 nm).This might dences (60-110 um). be partially attributed to the fact that the XRD result averages the structure information of the top 3.2.Microstructure features surface layer of about 5 um thick.All diffraction rings in the SAED pattern were identified as bcc The experimental results clearly demonstrated Fe,and no other phases were detected. that nanostructures developed in the surface layer The microstrain determined from XRD analysis of the Fe plate during the treatment.In order to decreases significantly along the depth in the sur- understand the microstructure evolution process in face layer and gradually drops to zero at about 60 the surface layer during the treatment,a systematic um deep.From cross-sectional TEM and SEM investigation on the microstructure in the surface observations,we noticed evidences of dislocation layer at different stages of straining is needed.As activities induced by the attrition treatment in even the straining decreases from maximum at the top deeper matrix (up to 110 um deep),where no surface layer to zero in the matrix,the structure change in grain size and atomic-level microstrain evolution process during the SMA treatment may is detected.The measured average grain (or cell) be signed by the microstructure characteristics size and the mean microstrain as a function of (with different strains)at different depths from the depth in the SMA treated Fe sample by using dif- top surface to deep matrix.Therefore,detailed ferent analysis techniques (XRD,SEM,and TEM) cross-sectional TEM observations were performed are summarized in Fig.4.In terms of the grain (or on the treated Fe sample. cell)size,the SMA treated surface layer can be subdivided into four sections along depth from the 3.2.1.Dislocations,dense dislocation wall and top surface: dislocation tangle Fig.5 shows TEM observations in the defor- section (i):nanostructured regime (0-15 um); mation layer at low strains adjacent to the strain- section (ii):submicro-sized regime(15-40 um); free matrix(60-80 um deep from the top surface,N.R. Tao et al. / Acta Materialia 50 (2002) 4603–4616 4607 Fig. 3. (a) Bright-field and (b) dark-field TEM images showing planar microstructures of the top surface layer in the SMA treated Fe sample (insert is a statistic distribution of grain size derived from the dark-field TEM images). cated by the selected area electron diffraction (SAED) pattern. The histogram of grain size distribution obtained from the dark-field images was characterized by a normal logarithmic distribution with a narrow size distribution (insert). The mean grain size is approximately 7 nm, which is slightly smaller than the XRD result (12 nm). This might be partially attributed to the fact that the XRD result averages the structure information of the top surface layer of about 5 µm thick. All diffraction rings in the SAED pattern were identified as bcc Fe, and no other phases were detected. The microstrain determined from XRD analysis decreases significantly along the depth in the surface layer and gradually drops to zero at about 60 µm deep. From cross-sectional TEM and SEM observations, we noticed evidences of dislocation activities induced by the attrition treatment in even deeper matrix (up to 110 µm deep), where no change in grain size and atomic-level microstrain is detected. The measured average grain (or cell) size and the mean microstrain as a function of depth in the SMA treated Fe sample by using different analysis techniques (XRD, SEM, and TEM) are summarized in Fig. 4. In terms of the grain (or cell) size, the SMA treated surface layer can be subdivided into four sections along depth from the top surface: section (i): nanostructured regime (0–15 µm); section (ii): submicro-sized regime (15–40 µm); Fig. 4. Variations of the grain/cell size and the mean microstrain with the depth from the treated surface of the Fe sample determined by means of XRD analysis, TEM and SEM observations. In TEM observations, sizes of the equiaxed cells and the lamellar cells (along short axis and long axis) are measured. section (iii): micro-sized regime (40–60 µm); section (iv): matrix with plastic deformation evidences (60–110 µm). 3.2. Microstructure features The experimental results clearly demonstrated that nanostructures developed in the surface layer of the Fe plate during the treatment. In order to understand the microstructure evolution process in the surface layer during the treatment, a systematic investigation on the microstructure in the surface layer at different stages of straining is needed. As the straining decreases from maximum at the top surface layer to zero in the matrix, the structure evolution process during the SMA treatment may be signed by the microstructure characteristics (with different strains) at different depths from the top surface to deep matrix. Therefore, detailed cross-sectional TEM observations were performed on the treated Fe sample. 3.2.1. Dislocations, dense dislocation wall and dislocation tangle Fig. 5 shows TEM observations in the deformation layer at low strains adjacent to the strainfree matrix (60–80 µm deep from the top surface