正在加载图片...
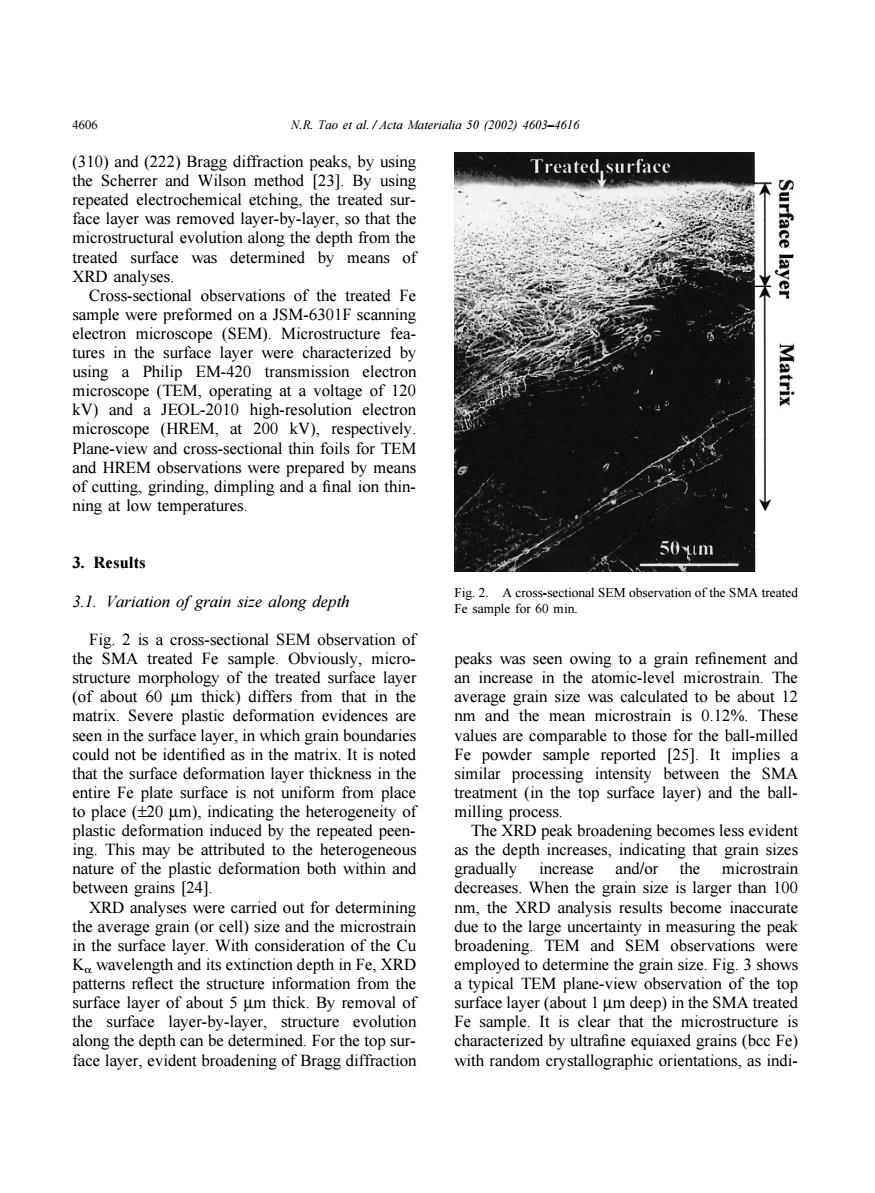
4606 N.R.Tao et al.Acta Materialia 50 (2002)4603-4616 (310)and(222)Bragg diffraction peaks,by using I reated. surface the Scherrer and Wilson method [23].By using repeated electrochemical etching,the treated sur- face layer was removed layer-by-layer,so that the microstructural evolution along the depth from the treated surface was determined by means of XRD analyses. Surface layer Cross-sectional observations of the treated Fe sample were preformed on a JSM-6301F scanning electron microscope (SEM).Microstructure fea- tures in the surface layer were characterized by using a Philip EM-420 transmission electron microscope (TEM,operating at a voltage of 120 Matrix kV)and a JEOL-2010 high-resolution electron microscope (HREM,at 200 kV),respectively. Plane-view and cross-sectional thin foils for TEM and HREM observations were prepared by means of cutting,grinding,dimpling and a final ion thin- ning at low temperatures. 50um 3.Results 3.1.Variation of grain size along depth Fig.2.A cross-sectional SEM observation of the SMA treated Fe sample for 60 min. Fig.2 is a cross-sectional SEM observation of the SMA treated Fe sample.Obviously,micro- peaks was seen owing to a grain refinement and structure morphology of the treated surface layer an increase in the atomic-level microstrain.The (of about 60 um thick)differs from that in the average grain size was calculated to be about 12 matrix.Severe plastic deformation evidences are nm and the mean microstrain is 0.12%.These seen in the surface layer,in which grain boundaries values are comparable to those for the ball-milled could not be identified as in the matrix.It is noted Fe powder sample reported [25].It implies a that the surface deformation layer thickness in the similar processing intensity between the SMA entire Fe plate surface is not uniform from place treatment(in the top surface layer)and the ball- to place (+20 um),indicating the heterogeneity of milling process. plastic deformation induced by the repeated peen- The XRD peak broadening becomes less evident ing.This may be attributed to the heterogeneous as the depth increases,indicating that grain sizes nature of the plastic deformation both within and gradually increase and/or the microstrain between grains [24]. decreases.When the grain size is larger than 100 XRD analyses were carried out for determining nm,the XRD analysis results become inaccurate the average grain (or cell)size and the microstrain due to the large uncertainty in measuring the peak in the surface layer.With consideration of the Cu broadening.TEM and SEM observations were Ko wavelength and its extinction depth in Fe,XRD employed to determine the grain size.Fig.3 shows patterns reflect the structure information from the a typical TEM plane-view observation of the top surface layer of about 5 um thick.By removal of surface layer(about 1 um deep)in the SMA treated the surface layer-by-layer,structure evolution Fe sample.It is clear that the microstructure is along the depth can be determined.For the top sur- characterized by ultrafine equiaxed grains(bcc Fe) face layer,evident broadening of Bragg diffraction with random crystallographic orientations,as indi-4606 N.R. Tao et al. / Acta Materialia 50 (2002) 4603–4616 (310) and (222) Bragg diffraction peaks, by using the Scherrer and Wilson method [23]. By using repeated electrochemical etching, the treated surface layer was removed layer-by-layer, so that the microstructural evolution along the depth from the treated surface was determined by means of XRD analyses. Cross-sectional observations of the treated Fe sample were preformed on a JSM-6301F scanning electron microscope (SEM). Microstructure features in the surface layer were characterized by using a Philip EM-420 transmission electron microscope (TEM, operating at a voltage of 120 kV) and a JEOL-2010 high-resolution electron microscope (HREM, at 200 kV), respectively. Plane-view and cross-sectional thin foils for TEM and HREM observations were prepared by means of cutting, grinding, dimpling and a final ion thinning at low temperatures. 3. Results 3.1. Variation of grain size along depth Fig. 2 is a cross-sectional SEM observation of the SMA treated Fe sample. Obviously, microstructure morphology of the treated surface layer (of about 60 µm thick) differs from that in the matrix. Severe plastic deformation evidences are seen in the surface layer, in which grain boundaries could not be identified as in the matrix. It is noted that the surface deformation layer thickness in the entire Fe plate surface is not uniform from place to place (±20 µm), indicating the heterogeneity of plastic deformation induced by the repeated peening. This may be attributed to the heterogeneous nature of the plastic deformation both within and between grains [24]. XRD analyses were carried out for determining the average grain (or cell) size and the microstrain in the surface layer. With consideration of the Cu Kα wavelength and its extinction depth in Fe, XRD patterns reflect the structure information from the surface layer of about 5 µm thick. By removal of the surface layer-by-layer, structure evolution along the depth can be determined. For the top surface layer, evident broadening of Bragg diffraction Fig. 2. A cross-sectional SEM observation of the SMA treated Fe sample for 60 min. peaks was seen owing to a grain refinement and an increase in the atomic-level microstrain. The average grain size was calculated to be about 12 nm and the mean microstrain is 0.12%. These values are comparable to those for the ball-milled Fe powder sample reported [25]. It implies a similar processing intensity between the SMA treatment (in the top surface layer) and the ballmilling process. The XRD peak broadening becomes less evident as the depth increases, indicating that grain sizes gradually increase and/or the microstrain decreases. When the grain size is larger than 100 nm, the XRD analysis results become inaccurate due to the large uncertainty in measuring the peak broadening. TEM and SEM observations were employed to determine the grain size. Fig. 3 shows a typical TEM plane-view observation of the top surface layer (about 1 µm deep) in the SMA treated Fe sample. It is clear that the microstructure is characterized by ultrafine equiaxed grains (bcc Fe) with random crystallographic orientations, as indi-