正在加载图片...
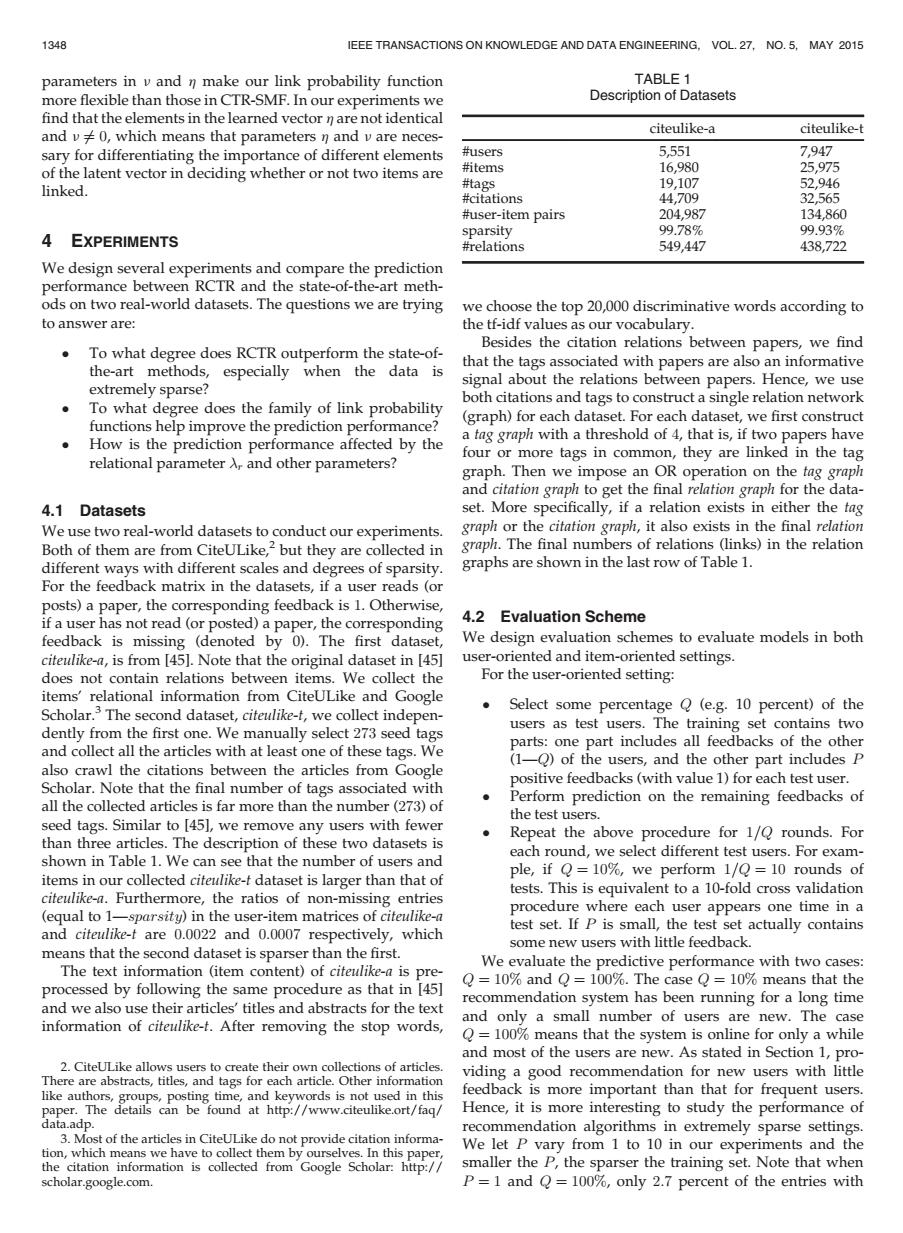
1348 IEEE TRANSACTIONS ON KNOWLEDGE AND DATA ENGINEERING.VOL.27,NO.5,MAY 2015 parameters in v and n make our link probability function TABLE 1 more flexible than those in CTR-SMF.In our experiments we Description of Datasets find that the elements in the learned vector n are not identical citeulike-a citeulike-t and v0,which means that parameters n and v are neces- sary for differentiating the importance of different elements #users 5,551 7,947 of the latent vector in deciding whether or not two items are #items 16,980 25,975 linked. #tags 19,107 52,946 #citations 44,709 32565 #user-item pairs 204,987 134860 sparsity 99.78% 99.93% 4 EXPERIMENTS #relations 549,447 438,722 We design several experiments and compare the prediction performance between RCTR and the state-of-the-art meth- ods on two real-world datasets.The questions we are trying we choose the top 20,000 discriminative words according to to answer are: the tf-idf values as our vocabulary. To what degree does RCTR outperform the state-of- Besides the citation relations between papers,we find the-art methods, especially when the data is that the tags associated with papers are also an informative signal about the relations between papers.Hence,we use extremely sparse? To what degree does the family of link probability both citations and tags to construct a single relation network (graph)for each dataset.For each dataset,we first construct functions help improve the prediction performance? How is the prediction performance affected by the a tag graph with a threshold of 4,that is,if two papers have four or more tags in common,they are linked in the tag relational parameter A,and other parameters? graph.Then we impose an OR operation on the tag graph and citation graph to get the final relation graph for the data- 4.1 Datasets set.More specifically,if a relation exists in either the tag We use two real-world datasets to conduct our experiments. graph or the citation graph,it also exists in the final relation Both of them are from CiteULike,2 but they are collected in graph.The final numbers of relations (links)in the relation different ways with different scales and degrees of sparsity. graphs are shown in the last row of Table 1. For the feedback matrix in the datasets,if a user reads (or posts)a paper,the corresponding feedback is 1.Otherwise, if a user has not read (or posted)a paper,the corresponding 4.2 Evaluation Scheme feedback is missing (denoted by 0).The first dataset, We design evaluation schemes to evaluate models in both citeulike-a,is from [45].Note that the original dataset in [45] user-oriented and item-oriented settings. does not contain relations between items.We collect the For the user-oriented setting: items'relational information from CiteULike and Google Scholar.3 The second dataset,citeulike-t,we collect indepen- Select some percentage Q (e.g.10 percent)of the users as test users.The training set contains two dently from the first one.We manually select 273 seed tags and collect all the articles with at least one of these tags.We parts:one part includes all feedbacks of the other also crawl the citations between the articles from Google (1-Q)of the users,and the other part includes P positive feedbacks(with value 1)for each test user. Scholar.Note that the final number of tags associated with Perform prediction on the remaining feedbacks of all the collected articles is far more than the number(273)of the test users. seed tags.Similar to [451,we remove any users with fewer Repeat the above procedure for 1/Q rounds.For than three articles.The description of these two datasets is shown in Table 1.We can see that the number of users and each round,we select different test users.For exam- ple,if Q=10%,we perform 1/Q=10 rounds of items in our collected citeulike-t dataset is larger than that of tests.This is equivalent to a 10-fold cross validation citeulike-a.Furthermore,the ratios of non-missing entries (equal to 1-sparsity)in the user-item matrices of citeulike-a procedure where each user appears one time in a test set.If P is small,the test set actually contains and citeulike-t are 0.0022 and 0.0007 respectively,which means that the second dataset is sparser than the first. some new users with little feedback. The text information (item content)of citeulike-a is pre- We evaluate the predictive performance with two cases: processed by following the same procedure as that in 145] Q=10%and Q=100%.The case Q=10%means that the recommendation system has been running for a long time and we also use their articles'titles and abstracts for the text and only a small number of users are new.The case information of citeulike-t.After removing the stop words, Q=100%means that the system is online for only a while and most of the users are new.As stated in Section 1,pro- 2.CiteULike allows users to create their own collections of articles. There are abstracts,titles,and tags for each article.Other information viding a good recommendation for new users with little like authors,groups,posting time,and keywords is not used in this feedback is more important than that for frequent users. paper.The details can be found at http://www.citeulike.ort/faq/ Hence,it is more interesting to study the performance of data.adp. recommendation algorithms in extremely sparse settings. 3.Most of the articles in CiteULike do not provide citation informa- tion,which means we have to collect them by ourselves.In this paper We let P vary from 1 to 10 in our experiments and the the citation information is collected from Google Scholar:http:// smaller the P,the sparser the training set.Note that when scholar.google.com. P=1 and Q=100%,only 2.7 percent of the entries withparameters in n and h make our link probability function more flexible than those in CTR-SMF. In our experiments we find that the elements in the learned vector h are not identical and n 6¼ 0, which means that parameters h and n are necessary for differentiating the importance of different elements of the latent vector in deciding whether or not two items are linked. 4 EXPERIMENTS We design several experiments and compare the prediction performance between RCTR and the state-of-the-art methods on two real-world datasets. The questions we are trying to answer are: To what degree does RCTR outperform the state-ofthe-art methods, especially when the data is extremely sparse? To what degree does the family of link probability functions help improve the prediction performance? How is the prediction performance affected by the relational parameter r and other parameters? 4.1 Datasets We use two real-world datasets to conduct our experiments. Both of them are from CiteULike,2 but they are collected in different ways with different scales and degrees of sparsity. For the feedback matrix in the datasets, if a user reads (or posts) a paper, the corresponding feedback is 1. Otherwise, if a user has not read (or posted) a paper, the corresponding feedback is missing (denoted by 0). The first dataset, citeulike-a, is from [45]. Note that the original dataset in [45] does not contain relations between items. We collect the items’ relational information from CiteULike and Google Scholar.3 The second dataset, citeulike-t, we collect independently from the first one. We manually select 273 seed tags and collect all the articles with at least one of these tags. We also crawl the citations between the articles from Google Scholar. Note that the final number of tags associated with all the collected articles is far more than the number (273) of seed tags. Similar to [45], we remove any users with fewer than three articles. The description of these two datasets is shown in Table 1. We can see that the number of users and items in our collected citeulike-t dataset is larger than that of citeulike-a. Furthermore, the ratios of non-missing entries (equal to 1—sparsity) in the user-item matrices of citeulike-a and citeulike-t are 0:0022 and 0:0007 respectively, which means that the second dataset is sparser than the first. The text information (item content) of citeulike-a is preprocessed by following the same procedure as that in [45] and we also use their articles’ titles and abstracts for the text information of citeulike-t. After removing the stop words, we choose the top 20,000 discriminative words according to the tf-idf values as our vocabulary. Besides the citation relations between papers, we find that the tags associated with papers are also an informative signal about the relations between papers. Hence, we use both citations and tags to construct a single relation network (graph) for each dataset. For each dataset, we first construct a tag graph with a threshold of 4, that is, if two papers have four or more tags in common, they are linked in the tag graph. Then we impose an OR operation on the tag graph and citation graph to get the final relation graph for the dataset. More specifically, if a relation exists in either the tag graph or the citation graph, it also exists in the final relation graph. The final numbers of relations (links) in the relation graphs are shown in the last row of Table 1. 4.2 Evaluation Scheme We design evaluation schemes to evaluate models in both user-oriented and item-oriented settings. For the user-oriented setting: Select some percentage Q (e.g. 10 percent) of the users as test users. The training set contains two parts: one part includes all feedbacks of the other (1—Q) of the users, and the other part includes P positive feedbacks (with value 1) for each test user. Perform prediction on the remaining feedbacks of the test users. Repeat the above procedure for 1=Q rounds. For each round, we select different test users. For example, if Q ¼ 10%, we perform 1=Q ¼ 10 rounds of tests. This is equivalent to a 10-fold cross validation procedure where each user appears one time in a test set. If P is small, the test set actually contains some new users with little feedback. We evaluate the predictive performance with two cases: Q ¼ 10% and Q ¼ 100%. The case Q ¼ 10% means that the recommendation system has been running for a long time and only a small number of users are new. The case Q ¼ 100% means that the system is online for only a while and most of the users are new. As stated in Section 1, providing a good recommendation for new users with little feedback is more important than that for frequent users. Hence, it is more interesting to study the performance of recommendation algorithms in extremely sparse settings. We let P vary from 1 to 10 in our experiments and the smaller the P, the sparser the training set. Note that when P ¼ 1 and Q ¼ 100%, only 2:7 percent of the entries with TABLE 1 Description of Datasets citeulike-a citeulike-t #users 5,551 7,947 #items 16,980 25,975 #tags 19,107 52,946 #citations 44,709 32,565 #user-item pairs 204,987 134,860 sparsity 99.78% 99.93% #relations 549,447 438,722 2. CiteULike allows users to create their own collections of articles. There are abstracts, titles, and tags for each article. Other information like authors, groups, posting time, and keywords is not used in this paper. The details can be found at http://www.citeulike.ort/faq/ data.adp. 3. Most of the articles in CiteULike do not provide citation information, which means we have to collect them by ourselves. In this paper, the citation information is collected from Google Scholar: http:// scholar.google.com. 1348 IEEE TRANSACTIONS ON KNOWLEDGE AND DATA ENGINEERING, VOL. 27, NO. 5, MAY 2015�