正在加载图片...
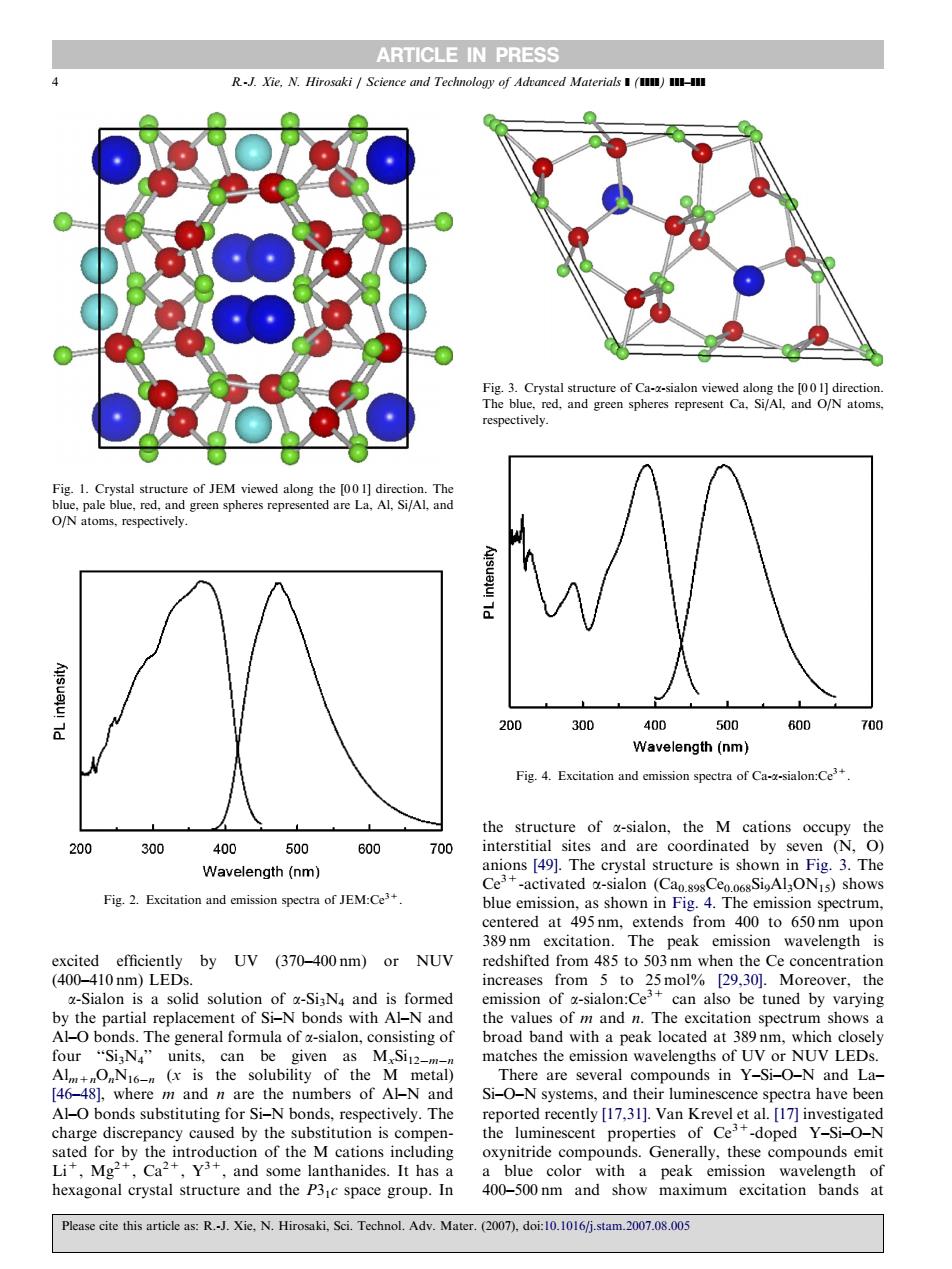
ARTICLE IN PRESS respectively. ig.1.Crystal st 200 300 40n 500 60D Wavelength (nm) Fig.4.Excitation and cmission spectra of Ca-x-sialon:Ce' 300 00 500 600 700 Wavelength(nm) Ce Fig.Excitation and cmission ctra of JM:C spectrum excited efficiently by UV (370-400nm)or NUV redshifted from 485 to 503nm when the Ce concentration [29,30].Moreover, the -Sialon is a can tati be tuned by varying bonds The generafou ofinof Th matches the emission wavelengths of Ur NUV LEDs bility of t Si-O-N are severa compounds in Y L Al-O bonds substituting for Si-N bonds.respectively.The rted recently [17.311.Van Krevel et al.[17]inve charge discrepancy caused by the substitution is compen- odrpytsntrotctioaoteMatoincting oxynitride compo 400-500cl Please cite this article as:R.Xie,N.Hirosaki,Sci.Technol.Adv.Mater (2007 doi10.1016j.stam.2007.08.00 excited efficiently by UV (370–400 nm) or NUV (400–410 nm) LEDs. a-Sialon is a solid solution of a-Si3N4 and is formed by the partial replacement of Si–N bonds with Al–N and Al–O bonds. The general formula of a-sialon, consisting of four ‘‘Si3N4’’ units, can be given as MxSi12mn Alm+nOnN16n (x is the solubility of the M metal) [46–48], where m and n are the numbers of Al–N and Al–O bonds substituting for Si–N bonds, respectively. The charge discrepancy caused by the substitution is compensated for by the introduction of the M cations including Li+, Mg2+, Ca2+, Y3+, and some lanthanides. It has a hexagonal crystal structure and the P31c space group. In the structure of a-sialon, the M cations occupy the interstitial sites and are coordinated by seven (N, O) anions [49]. The crystal structure is shown in Fig. 3. The Ce3+-activated a-sialon (Ca0.898Ce0.068Si9Al3ON15) shows blue emission, as shown in Fig. 4. The emission spectrum, centered at 495 nm, extends from 400 to 650 nm upon 389 nm excitation. The peak emission wavelength is redshifted from 485 to 503 nm when the Ce concentration increases from 5 to 25 mol% [29,30]. Moreover, the emission of a-sialon:Ce3+ can also be tuned by varying the values of m and n. The excitation spectrum shows a broad band with a peak located at 389 nm, which closely matches the emission wavelengths of UV or NUV LEDs. There are several compounds in Y–Si–O–N and La– Si–O–N systems, and their luminescence spectra have been reported recently [17,31]. Van Krevel et al. [17] investigated the luminescent properties of Ce3+-doped Y–Si–O–N oxynitride compounds. Generally, these compounds emit a blue color with a peak emission wavelength of 400–500 nm and show maximum excitation bands at ARTICLE IN PRESS Fig. 2. Excitation and emission spectra of JEM:Ce3+. Fig. 4. Excitation and emission spectra of Ca-a-sialon:Ce3+. Fig. 1. Crystal structure of JEM viewed along the [0 0 1] direction. The blue, pale blue, red, and green spheres represented are La, Al, Si/Al, and O/N atoms, respectively. Fig. 3. Crystal structure of Ca-a-sialon viewed along the [0 0 1] direction. The blue, red, and green spheres represent Ca, Si/Al, and O/N atoms, respectively. 4 R.-J. Xie, N. Hirosaki / Science and Technology of Advanced Materials ] (]]]]) ]]]–]]] Please cite this article as: R.-J. Xie, N. Hirosaki, Sci. Technol. Adv. Mater. (2007), doi:10.1016/j.stam.2007.08.005���