正在加载图片...
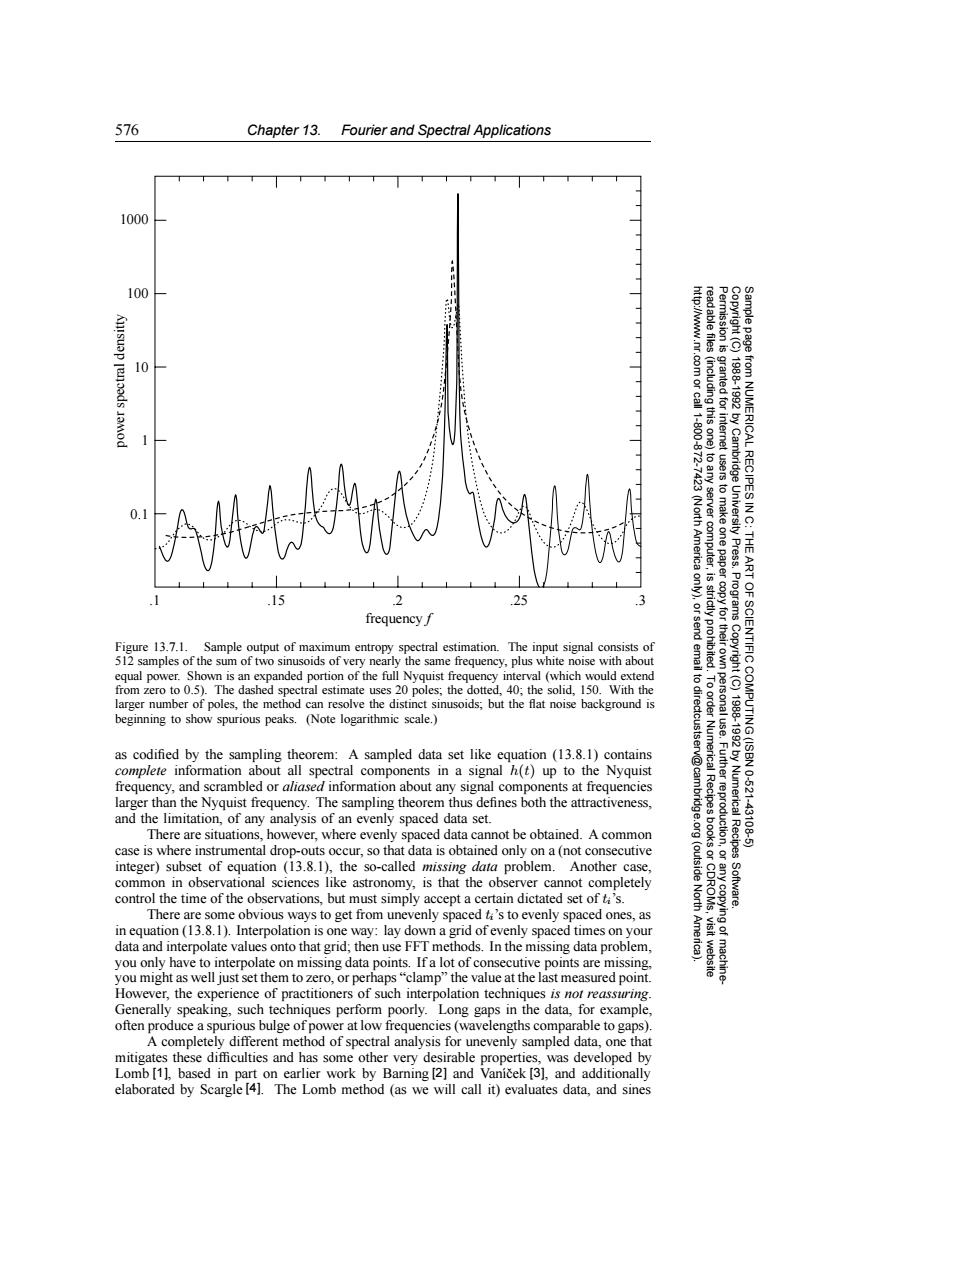
576 Chapter 13.Fourier and Spectral Applications 1000 100 10 .com or call 1-800-872- (including this one) granted for interet -7423(North America to any server computer,is tusers to make one paper from NUMERICAL RECIPES IN C: 1988-1992 by Cambridge University Press.Programs THE 是 .15 2 .25 frequency Figure 13.7.1. Sample output of maximum entropy spectral estimation.The input signal consists of 512 samples of the sum of two sinusoids of very nearly the same frequency,plus white noise with about equal power.Shown is an expanded portion of the full Nyquist frequency interval (which would extend from zero to 0.5).The dashed spectral estimate uses 20 poles;the dotted,40;the solid,150.With the to dir Copyright (C) larger number of poles,the method can resolve the distinct sinusoids;but the flat noise background is beginning to show spurious peaks.(Note logarithmic scale.) ectcustser as codified by the sampling theorem:A sampled data set like equation (13.8.1)contains ART OF SCIENTIFIC COMPUTING(ISBN 0-521 complete information about all spectral components in a signal h(t)up to the Nyquist v@cam frequency,and scrambled or aliased information about any signal components at frequencies larger than the Nyquist frequency.The sampling theorem thus defines both the attractiveness, and the limitation,of any analysis of an evenly spaced data set. .Further reproduction, 1988-1992 by Numerical Recipes There are situations,however,where evenly spaced data cannot be obtained.A common -43108-5 case is where instrumental drop-outs occur,so that data is obtained only on a (not consecutive integer)subset of equation (13.8.1),the so-called missing data problem.Another case, (outside common in observational sciences like astronomy,is that the observer cannot completely control the time of the observations,but must simply accept a certain dictated set of ti's. North Software. There are some obvious ways to get from unevenly spaced t's to evenly spaced ones,as in equation (13.8.1).Interpolation is one way:lay down a grid of evenly spaced times on your Ame data and interpolate values onto that grid;then use FFT methods.In the missing data problem, you only have to interpolate on missing data points.If a lot of consecutive points are missing. you might as well just set them to zero,or perhaps"clamp"the value at the last measured point. However,the experience of practitioners of such interpolation techniques is not reassuring Generally speaking,such techniques perform poorly.Long gaps in the data,for example, often produce a spurious bulge of power at low frequencies(wavelengths comparable to gaps) A completely different method of spectral analysis for unevenly sampled data,one that mitigates these difficulties and has some other very desirable properties,was developed by Lomb[1],based in part on earlier work by Barning [2]and Vanicek [3],and additionally elaborated by Scargle [4].The Lomb method (as we will call it)evaluates data,and sines576 Chapter 13. Fourier and Spectral Applications Permission is granted for internet users to make one paper copy for their own personal use. Further reproduction, or any copyin Copyright (C) 1988-1992 by Cambridge University Press. Programs Copyright (C) 1988-1992 by Numerical Recipes Software. Sample page from NUMERICAL RECIPES IN C: THE ART OF SCIENTIFIC COMPUTING (ISBN 0-521-43108-5) g of machinereadable files (including this one) to any server computer, is strictly prohibited. To order Numerical Recipes books or CDROMs, visit website http://www.nr.com or call 1-800-872-7423 (North America only), or send email to directcustserv@cambridge.org (outside North America). power spectral densitty 0.1 1 10 100 1000 .1 .15 .2 .25 .3 frequency f Figure 13.7.1. Sample output of maximum entropy spectral estimation. The input signal consists of 512 samples of the sum of two sinusoids of very nearly the same frequency, plus white noise with about equal power. Shown is an expanded portion of the full Nyquist frequency interval (which would extend from zero to 0.5). The dashed spectral estimate uses 20 poles; the dotted, 40; the solid, 150. With the larger number of poles, the method can resolve the distinct sinusoids; but the flat noise background is beginning to show spurious peaks. (Note logarithmic scale.) as codified by the sampling theorem: A sampled data set like equation (13.8.1) contains complete information about all spectral components in a signal h(t) up to the Nyquist frequency, and scrambled or aliased information about any signal components at frequencies larger than the Nyquist frequency. The sampling theorem thus defines both the attractiveness, and the limitation, of any analysis of an evenly spaced data set. There are situations, however, where evenly spaced data cannot be obtained. A common case is where instrumental drop-outs occur, so that data is obtained only on a (not consecutive integer) subset of equation (13.8.1), the so-called missing data problem. Another case, common in observational sciences like astronomy, is that the observer cannot completely control the time of the observations, but must simply accept a certain dictated set of ti’s. There are some obvious ways to get from unevenly spaced ti’s to evenly spaced ones, as in equation (13.8.1). Interpolation is one way: lay down a grid of evenly spaced times on your data and interpolate values onto that grid; then use FFT methods. In the missing data problem, you only have to interpolate on missing data points. If a lot of consecutive points are missing, you might as well just set them to zero, or perhaps “clamp” the value at the last measured point. However, the experience of practitioners of such interpolation techniques is not reassuring. Generally speaking, such techniques perform poorly. Long gaps in the data, for example, often produce a spurious bulge of power at low frequencies (wavelengths comparable to gaps). A completely different method of spectral analysis for unevenly sampled data, one that mitigates these difficulties and has some other very desirable properties, was developed by Lomb [1], based in part on earlier work by Barning [2] and Van´ıcek ˇ [3], and additionally elaborated by Scargle [4]. The Lomb method (as we will call it) evaluates data, and sines