正在加载图片...

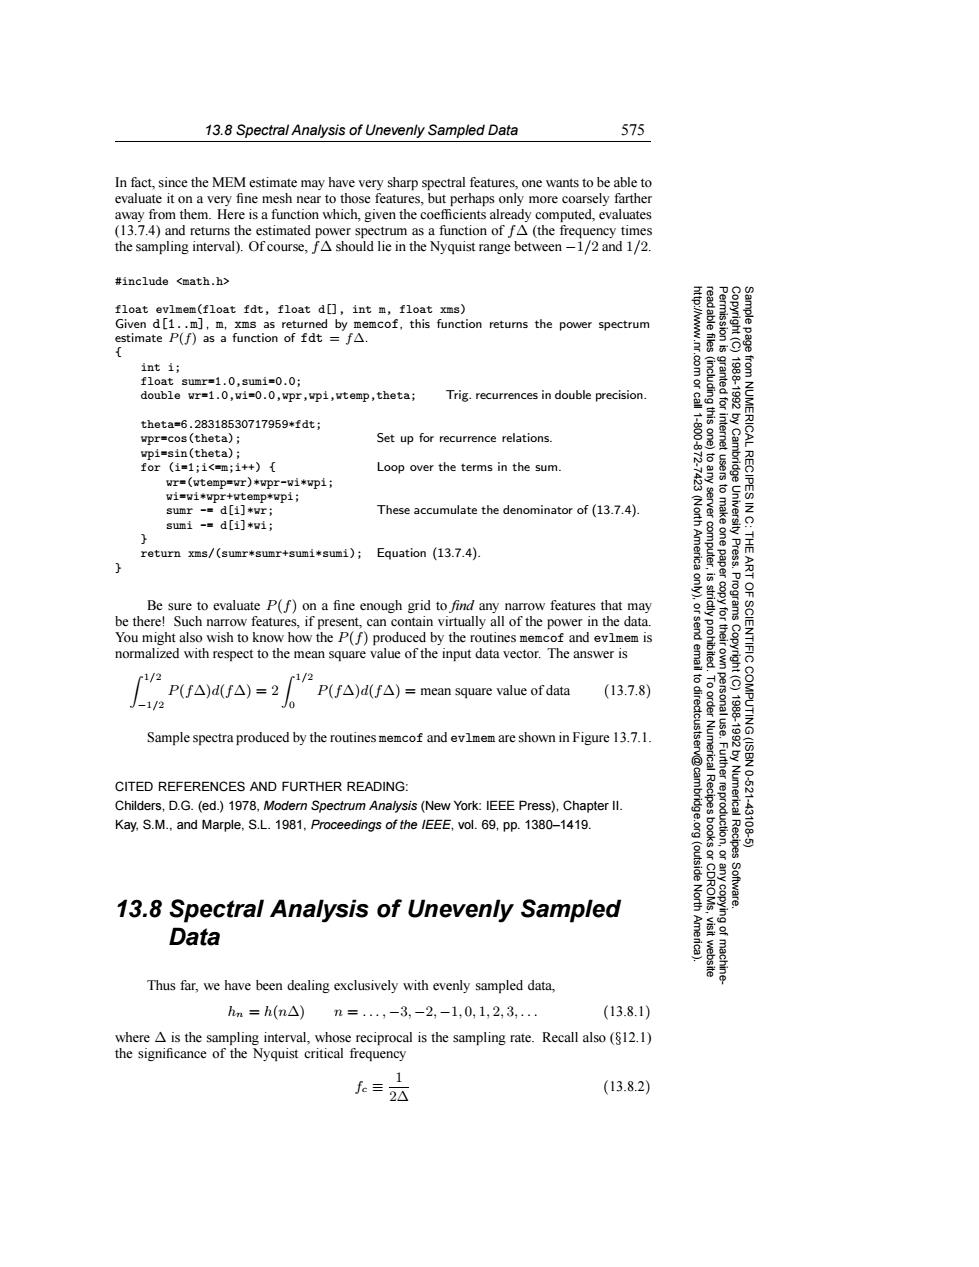
13.8 Spectral Analysis of Unevenly Sampled Data 575 In fact,since the MEM estimate may have very sharp spectral features,one wants to be able to evaluate it on a very fine mesh near to those features,but perhaps only more coarsely farther away from them.Here is a function which,given the coefficients already computed,evaluates (13.7.4)and returns the estimated power spectrum as a function of fA(the frequency times the sampling interval).Of course,fA should lie in the Nyquist range between-1/2 and 1/2. #include <math.h> float evlmem(float fdt,float d[],int m,float xms) Given d[1..m],m,xms as returned by memcof,this function returns the power spectrum estimate P(f)as a function of fdt =fA. f int i; float sumr=1.0,sumi=0.0; double wr=1.0,wi=0.0,wpr,wpi,wtemp,theta; Trig.recurrences in double precision. nted for thetas=6.28318530717959*fdt wpr=cos(theta); Set up for recurrence relations. wpi=sin(theta); for(i=1;1<=m;i+){ Loop over the terms in the sum wr=(wtemp=wr)*wpr-wi*wpi; RECIPES wi=wi*wpr+wtemp*wpi; sumr -d[i]*wr; These accumulate the denominator of(13.7.4). sumi -d[i]*wi; return xms/(sumr*sumr+sumi*sumi); Equation (13.7.4). 子二 Press. Be sure to evaluate P(f)on a fine enough grid to find any narrow features that may be there!Such narrow features,if present,can contain virtually all of the power in the data. You might also wish to know how the P(f)produced by the routines memcof and evlmem is normalized with respect to the mean square value of the input data vector.The answer is SCIENTIFIC r/ r1/2 6 P(fA)d(fA)=2 P(f△)d(f△)=mean square value of data (13.7.8) -1/2 n Sample spectra produced by the routines memcof and evlmem are shown in Figure 13.7.1. CITED REFERENCES AND FURTHER READING: Childers,D.G.(ed.)1978,Modern Spectrum Analysis(New York:IEEE Press),Chapter Il. Numerica 10621 Kay.S.M.,and Marple,S.L.1981,Proceedings of the /EEE,vol.69,pp.1380-1419. uctio Recipes 43108 (outside Software. 13.8 Spectral Analysis of Unevenly Sampled ying of Data Thus far,we have been dealing exclusively with evenly sampled data, hm=h(n△)n=.,-3,-2,-1,0,1,2,3,. (13.8.1) where A is the sampling interval,whose reciprocal is the sampling rate.Recall also (12.1) the significance of the Nyquist critical frequency 1 f:=2公 (13.8.2)13.8 Spectral Analysis of Unevenly Sampled Data 575 Permission is granted for internet users to make one paper copy for their own personal use. Further reproduction, or any copyin Copyright (C) 1988-1992 by Cambridge University Press. Programs Copyright (C) 1988-1992 by Numerical Recipes Software. Sample page from NUMERICAL RECIPES IN C: THE ART OF SCIENTIFIC COMPUTING (ISBN 0-521-43108-5) g of machinereadable files (including this one) to any server computer, is strictly prohibited. To order Numerical Recipes books or CDROMs, visit website http://www.nr.com or call 1-800-872-7423 (North America only), or send email to directcustserv@cambridge.org (outside North America). In fact, since the MEM estimate may have very sharp spectral features, one wants to be able to evaluate it on a very fine mesh near to those features, but perhaps only more coarsely farther away from them. Here is a function which, given the coefficients already computed, evaluates (13.7.4) and returns the estimated power spectrum as a function of f∆ (the frequency times the sampling interval). Of course, f∆ should lie in the Nyquist range between −1/2 and 1/2. #include <math.h> float evlmem(float fdt, float d[], int m, float xms) Given d[1..m], m, xms as returned by memcof, this function returns the power spectrum estimate P(f) as a function of fdt = f∆. { int i; float sumr=1.0,sumi=0.0; double wr=1.0,wi=0.0,wpr,wpi,wtemp,theta; Trig. recurrences in double precision. theta=6.28318530717959*fdt; wpr=cos(theta); Set up for recurrence relations. wpi=sin(theta); for (i=1;i<=m;i++) { Loop over the terms in the sum. wr=(wtemp=wr)*wpr-wi*wpi; wi=wi*wpr+wtemp*wpi; sumr -= d[i]*wr; These accumulate the denominator of (13.7.4). sumi -= d[i]*wi; } return xms/(sumr*sumr+sumi*sumi); Equation (13.7.4). } Be sure to evaluate P(f) on a fine enough grid to find any narrow features that may be there! Such narrow features, if present, can contain virtually all of the power in the data. You might also wish to know how the P(f) produced by the routines memcof and evlmem is normalized with respect to the mean square value of the input data vector. The answer is 1/2 −1/2 P(f∆)d(f∆) = 2 1/2 0 P(f∆)d(f∆) = mean square value of data (13.7.8) Sample spectra produced by the routines memcof and evlmem are shown in Figure 13.7.1. CITED REFERENCES AND FURTHER READING: Childers, D.G. (ed.) 1978, Modern Spectrum Analysis (New York: IEEE Press), Chapter II. Kay, S.M., and Marple, S.L. 1981, Proceedings of the IEEE, vol. 69, pp. 1380–1419. 13.8 Spectral Analysis of Unevenly Sampled Data Thus far, we have been dealing exclusively with evenly sampled data, hn = h(n∆) n = ..., −3, −2, −1, 0, 1, 2, 3,... (13.8.1) where ∆ is the sampling interval, whose reciprocal is the sampling rate. Recall also (§12.1) the significance of the Nyquist critical frequency fc ≡ 1 2∆ (13.8.2)