正在加载图片...

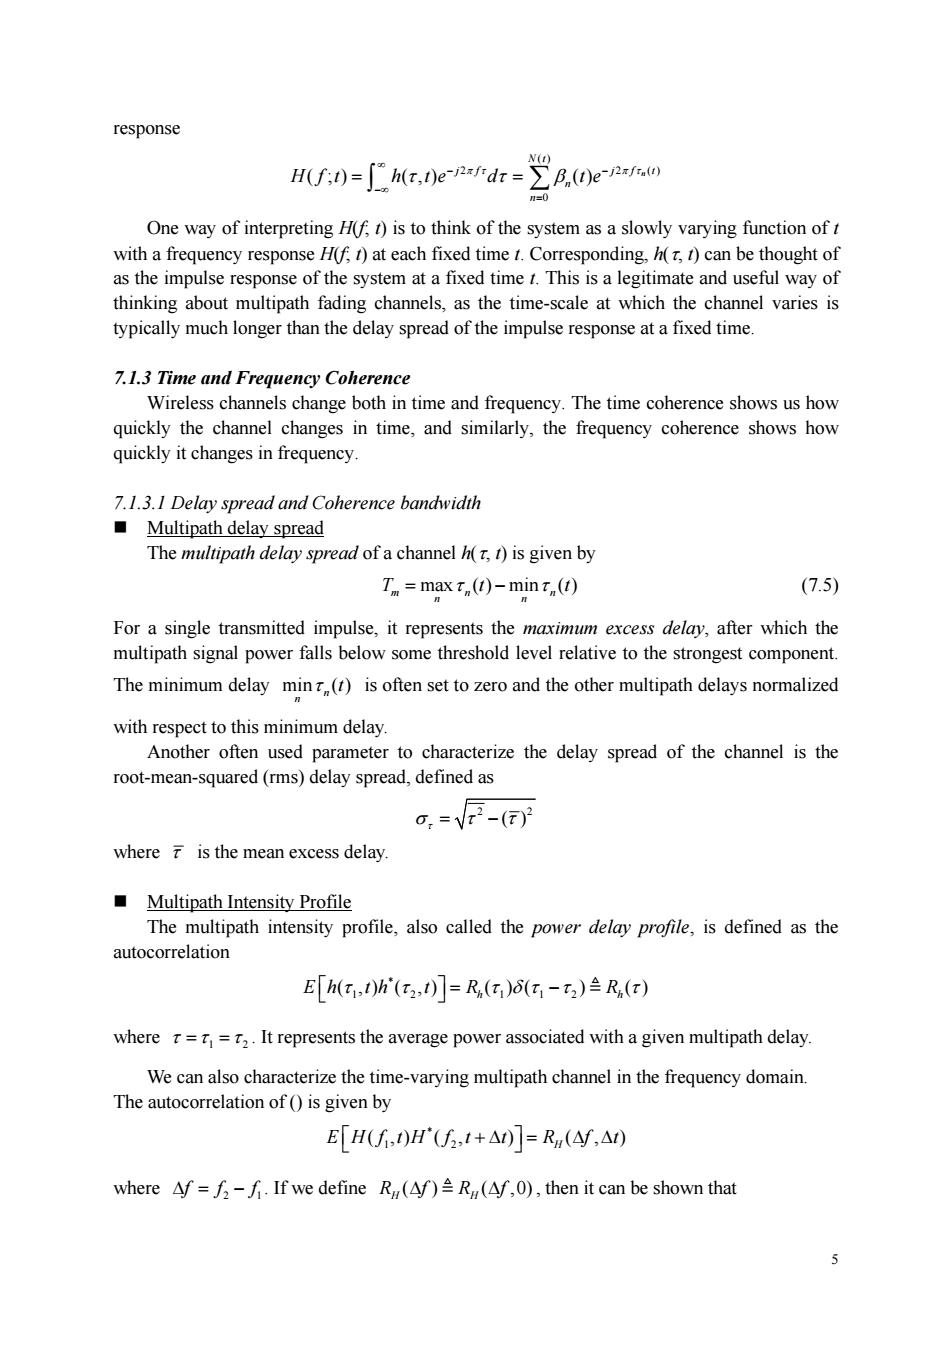
response Hf:()=[hr.D)esdrB.(e One way of interpreting H(f.t)is to think of the system as a slowly varying function of t with a frequency response H(f r)at each fixed time t.Corresponding,h()can be thought of as the impulse response of the system at a fixed time t.This is a legitimate and useful way of thinking about multipath fading channels. as the time-scale at which the channel varies is typically much longer than the delay spread of the impulse response at a fixed time 7.1.3 Time and Frequency Coherence Wireless channels change both in time and frequency.The time coherence shows us how quickly the channel changes in time,and similarly,the frequency coherence shows how quickly it changes in frequency 7.1.3.I Delay spread and Coherence bandwidth Multipath delay spread The multipath delay spread of a channel h()is given by T.=max t,()-mint,() (7.5) For a single transmitted impulse,it represents the maximum excess delay,after which the multipath signal power falls below some threshold level relative to the strongest component. The minimum delay min()is often set to zero and the other multipath delays normalized root-mean-squared(rms)delay spread,defined as ,=F-可 where is the mean excess delay Multipath Intensity Profile The multipath intensity profile.also called the power delay profile,is defined as the autocorrelation E[h(,)h'(,)]=R()1-t)兰R(r) where=.It represents the average power associated with a given multipath delay. We can also characterize the time-varying multipath channel in the frequency domain. The autocorrelation of(is given by EH(f,)H'(f,t+△)]=R,(Af,△) where f=f-f.If we define R(Af)R(f.0),then it can be shown that 5 response ( ) 2 2 () 0 ( ;) ( ,) () n N t j f jft n n H f t h te d te One way of interpreting H(f; t) is to think of the system as a slowly varying function of t with a frequency response H(f; t) at each fixed time t. Corresponding, h(, t) can be thought of as the impulse response of the system at a fixed time t. This is a legitimate and useful way of thinking about multipath fading channels, as the time-scale at which the channel varies is typically much longer than the delay spread of the impulse response at a fixed time. 7.1.3 Time and Frequency Coherence Wireless channels change both in time and frequency. The time coherence shows us how quickly the channel changes in time, and similarly, the frequency coherence shows how quickly it changes in frequency. 7.1.3.1 Delay spread and Coherence bandwidth Multipath delay spread The multipath delay spread of a channel h(, t) is given by max ( ) min ( ) mn n n n T tt (7.5) For a single transmitted impulse, it represents the maximum excess delay, after which the multipath signal power falls below some threshold level relative to the strongest component. The minimum delay min ( ) n n t is often set to zero and the other multipath delays normalized with respect to this minimum delay. Another often used parameter to characterize the delay spread of the channel is the root-mean-squared (rms) delay spread, defined as 2 2 ( ) where is the mean excess delay. Multipath Intensity Profile The multipath intensity profile, also called the power delay profile, is defined as the autocorrelation * 1 2 1 12 ( ,) ( ,) ( ) ( ) () E h th t R R h h where 1 2 . It represents the average power associated with a given multipath delay. We can also characterize the time-varying multipath channel in the frequency domain. The autocorrelation of () is given by * 1 2 ( ,) ( , ) ( , ) E H f tH f t t R f t H where 2 1 f f f . If we define ( ) ( ,0) RH H fRf , then it can be shown that