正在加载图片...
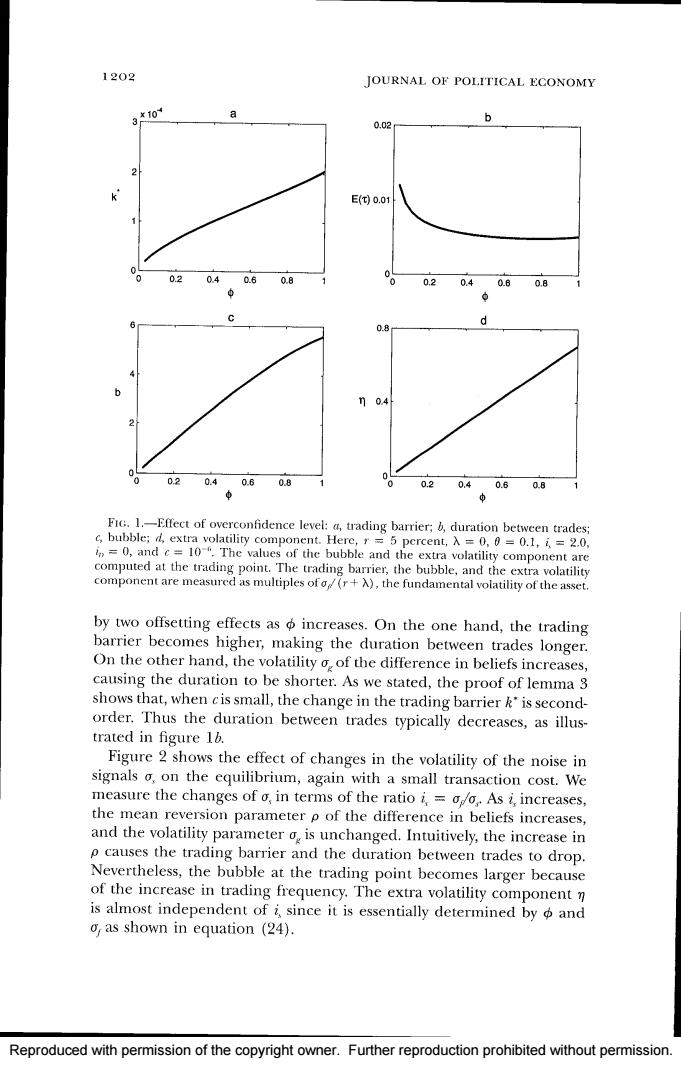
1202 JOURNAL OF POLITICAL ECONOMY 3*10 0.02 0 E()0.01 0.2 0.40.60.8 0.20.40.8 0.8 0 0.8 n04 02 0.4 0.60.8 0 0.20.40.6 0.8 FIG.1.-Effect of overconfidence level:a,trading barrier;duration between trades; c,bubble;d,extra volatility component.Here,r 5 percent,A =0.0=0.1,i,2.0, =0,and c=10-".The values of the bubble and the extra volatility component are computed at the trading point.The trading barrier,the bubble,and the extra volatility component are measured as multiples ofo(r+A),the fundamental volatility of the asset. by two offsetting effects as o increases.On the one hand,the trading barrier becomes higher,making the duration between trades longer. On the other hand,the volatility o.of the difference in beliefs increases, causing the duration to be shorter.As we stated,the proof of lemma 3 shows that,when cis small,the change in the trading barrier k'is second- order.Thus the duration between trades typically decreases,as illus- trated in figure 1b. Figure 2 shows the effect of changes in the volatility of the noise in signals o,on the equilibrium,again with a small transaction cost.We measure the changes of o,in terms of the ratio i=o/o,As i,increases, the mean reversion parameter p of the difference in beliefs increases, and the volatility parameter o,is unchanged.Intuitively,the increase in p causes the trading barrier and the duration between trades to drop. Nevertheless,the bubble at the trading point becomes larger because of the increase in trading frequency.The extra volatility component n is almost independent of i,since it is essentially determined by and o,as shown in equation (24). Reproduced with permission of the copyright owner.Further reproduction prohibited without permission.Reproduced with permission of the copyright owner. Further reproduction prohibited without permission