正在加载图片...

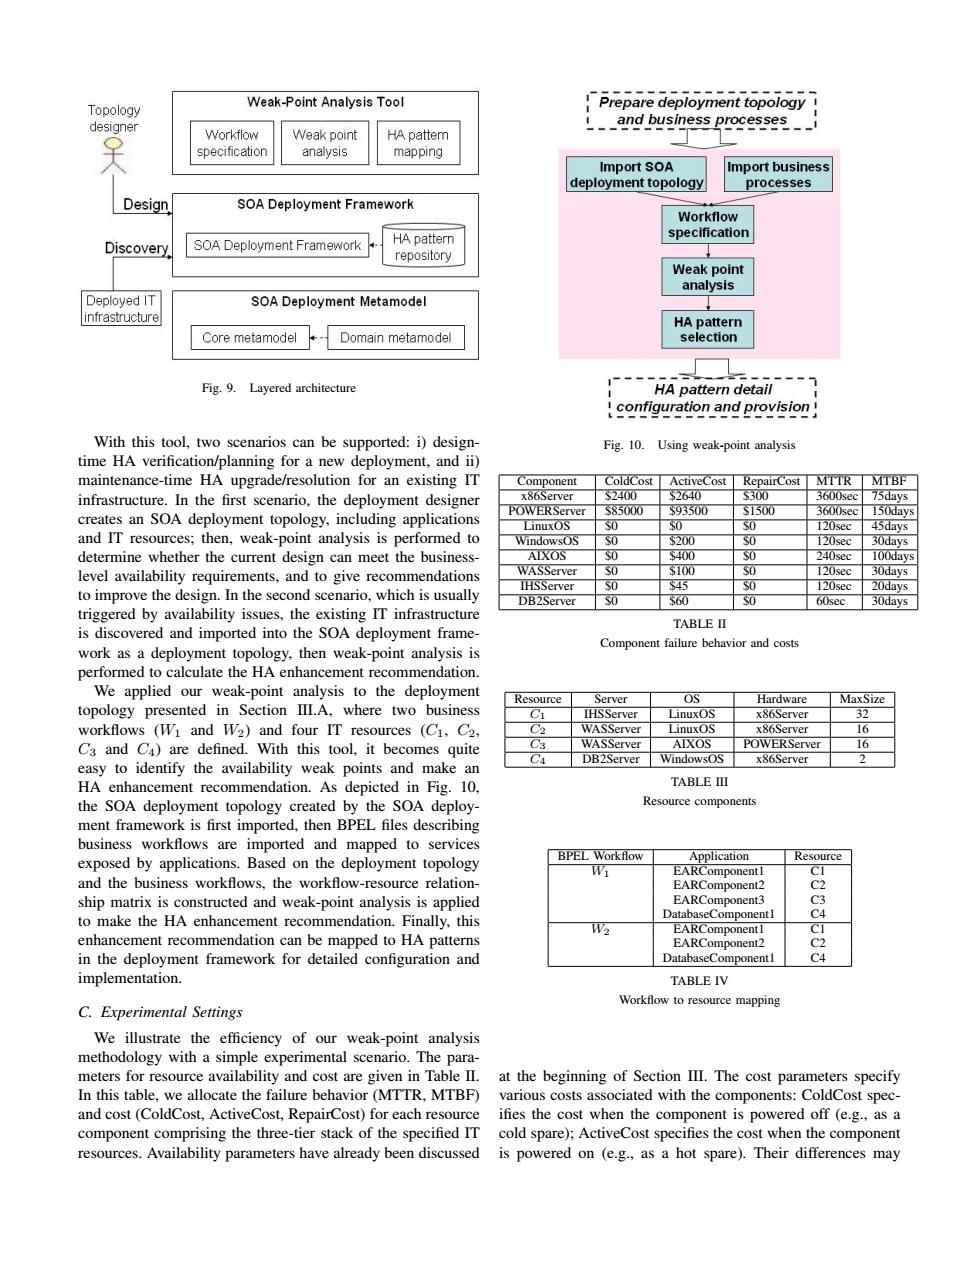
Topology Weak-Point Analysis Too Prepare deployment topology designer and business processes__ Workflow Weak point HA pattem specification analysis mapping Import SOA Import business deployment topology processes Design SOA Deployment Framework Workflow specification Discovery SOA Deployment Framework HA pattern repository Weak point analysis Deployed IT SOA Deployment Metamodel infrastructure HA pattern Core metamodel Domain metamodel selection Fig.9.Layered architecture HA pattern detail configuration and provision With this tool,two scenarios can be supported:i)design- Fig.10.Using weak-point analysis time HA verification/planning for a new deployment,and ii) maintenance-time HA upgrade/resolution for an existing IT Component ColdCost ActiveCost RepairCost MTTR MTBF infrastructure.In the first scenario,the deployment designer x86Server S2400 $2640 S300 3600sec 75days POWERServer S85000 593500 1500 3600sec creates an SOA deployment topology,including applications 150days LinuxOS SO 120sec 45days and IT resources;then,weak-point analysis is performed to WindowsOS SO $200 SO 120sec 30days determine whether the current design can meet the business- AIXOS S0 5400 SO 240sec 100days level availability requirements,and to give recommendations WASServer 0 S100 0 120sec 30days S0 45 SO 120sec to improve the design.In the second scenario,which is usually IHSServer 20days DB2Server S60 0 60sec 30days triggered by availability issues,the existing IT infrastructure TABLE II is discovered and imported into the SOA deployment frame- Component failure behavior and costs work as a deployment topology,then weak-point analysis is performed to calculate the HA enhancement recommendation. We applied our weak-point analysis to the deployment Resource Server OS Hardware MaxSize topology presented in Section III.A,where two business C1 IHSServer LinuxOS x86Server 32 workflows (Wi and W2)and four IT resources (C1,C2, C2 WASServer LinuxOS x86Server 16 C3 and C4)are defined.With this tool,it becomes quite C3 WASServer AIXOS POWERServer 16 C4 DB2Server WindowsOS x86Server 2 easy to identify the availability weak points and make an HA enhancement recommendation.As depicted in Fig.10, TABLE III the SOA deployment topology created by the SOA deploy- Resource components ment framework is first imported,then BPEL files describing business workflows are imported and mapped to services BPEL Workflow exposed by applications.Based on the deployment topology Application Resource W EARComponent1 CI and the business workflows,the workflow-resource relation- EARComponent2 C2 ship matrix is constructed and weak-point analysis is applied EARComponent3 C3 to make the HA enhancement recommendation.Finally,this DatabaseComponentI C4 W2 EARComponentI CI enhancement recommendation can be mapped to HA patterns EARComponent2 C2 in the deployment framework for detailed configuration and DatabaseComponentl C4 implementation. TABLE IV Workflow to resource mapping C.Experimental Settings We illustrate the efficiency of our weak-point analysis methodology with a simple experimental scenario.The para- meters for resource availability and cost are given in Table II.at the beginning of Section III.The cost parameters specify In this table,we allocate the failure behavior(MTTR,MTBF)various costs associated with the components:ColdCost spec and cost(ColdCost,ActiveCost,RepairCost)for each resource ifies the cost when the component is powered off (e.g.,as a component comprising the three-tier stack of the specified IT cold spare);ActiveCost specifies the cost when the component resources.Availability parameters have already been discussed is powered on (e.g.,as a hot spare).Their differences mayFig. 9. Layered architecture With this tool, two scenarios can be supported: i) designtime HA verification/planning for a new deployment, and ii) maintenance-time HA upgrade/resolution for an existing IT infrastructure. In the first scenario, the deployment designer creates an SOA deployment topology, including applications and IT resources; then, weak-point analysis is performed to determine whether the current design can meet the businesslevel availability requirements, and to give recommendations to improve the design. In the second scenario, which is usually triggered by availability issues, the existing IT infrastructure is discovered and imported into the SOA deployment framework as a deployment topology, then weak-point analysis is performed to calculate the HA enhancement recommendation. We applied our weak-point analysis to the deployment topology presented in Section III.A, where two business workflows (W1 and W2) and four IT resources (C1, C2, C3 and C4) are defined. With this tool, it becomes quite easy to identify the availability weak points and make an HA enhancement recommendation. As depicted in Fig. 10, the SOA deployment topology created by the SOA deployment framework is first imported, then BPEL files describing business workflows are imported and mapped to services exposed by applications. Based on the deployment topology and the business workflows, the workflow-resource relationship matrix is constructed and weak-point analysis is applied to make the HA enhancement recommendation. Finally, this enhancement recommendation can be mapped to HA patterns in the deployment framework for detailed configuration and implementation. C. Experimental Settings We illustrate the efficiency of our weak-point analysis methodology with a simple experimental scenario. The parameters for resource availability and cost are given in Table II. In this table, we allocate the failure behavior (MTTR, MTBF) and cost (ColdCost, ActiveCost, RepairCost) for each resource component comprising the three-tier stack of the specified IT resources. Availability parameters have already been discussed Fig. 10. Using weak-point analysis Component ColdCost ActiveCost RepairCost MTTR MTBF x86Server $2400 $2640 $300 3600sec 75days POWERServer $85000 $93500 $1500 3600sec 150days LinuxOS $0 $0 $0 120sec 45days WindowsOS $0 $200 $0 120sec 30days AIXOS $0 $400 $0 240sec 100days WASServer $0 $100 $0 120sec 30days IHSServer $0 $45 $0 120sec 20days DB2Server $0 $60 $0 60sec 30days TABLE II Component failure behavior and costs Resource Server OS Hardware MaxSize C1 IHSServer LinuxOS x86Server 32 C2 WASServer LinuxOS x86Server 16 C3 WASServer AIXOS POWERServer 16 C4 DB2Server WindowsOS x86Server 2 TABLE III Resource components BPEL Workflow Application Resource W1 EARComponent1 C1 EARComponent2 C2 EARComponent3 C3 DatabaseComponent1 C4 W2 EARComponent1 C1 EARComponent2 C2 DatabaseComponent1 C4 TABLE IV Workflow to resource mapping at the beginning of Section III. The cost parameters specify various costs associated with the components: ColdCost specifies the cost when the component is powered off (e.g., as a cold spare); ActiveCost specifies the cost when the component is powered on (e.g., as a hot spare). Their differences may