正在加载图片...

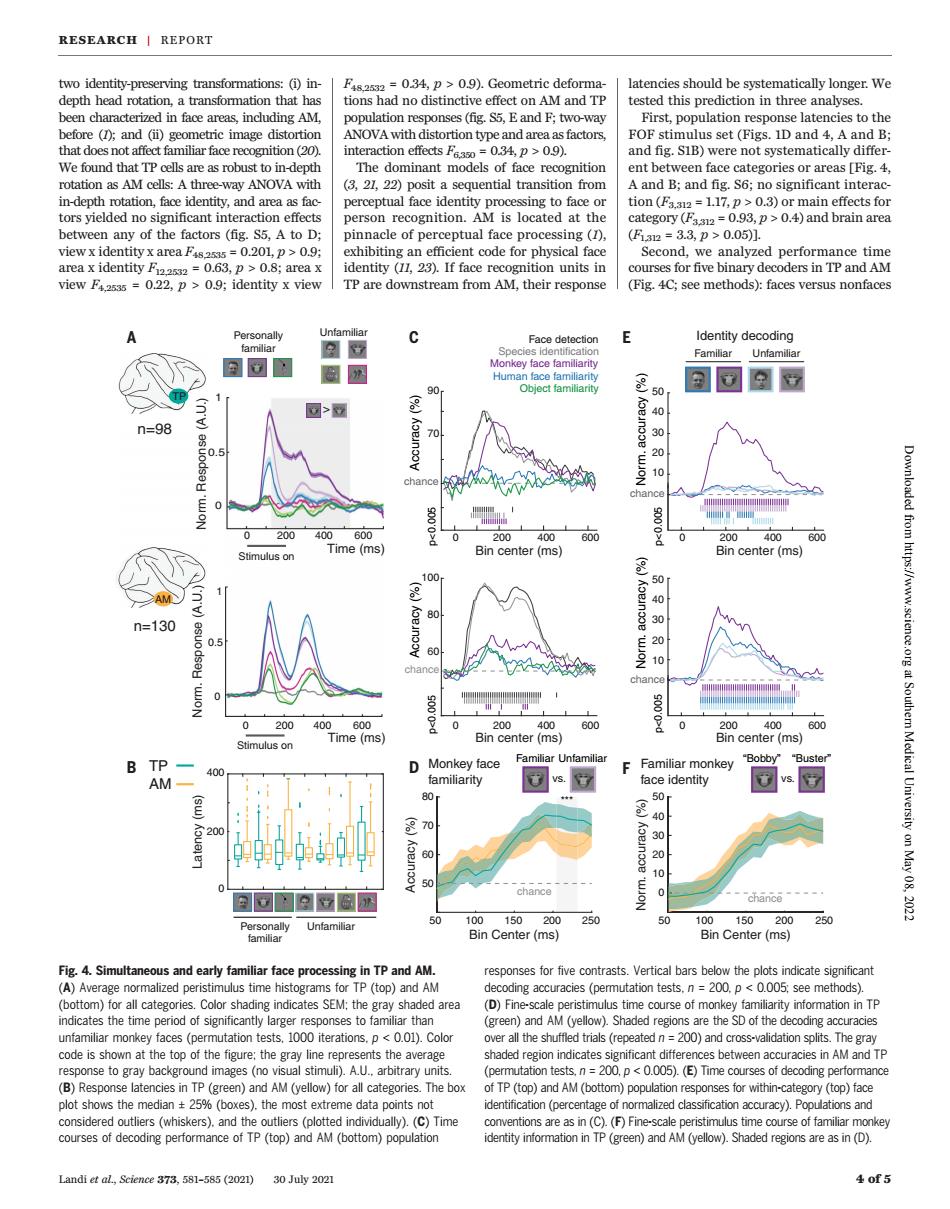
RESEARCH I REPORT rving transfo should be atically longer.We ANOVA with dis 4p>0.9 d fig.SIB)were not systematically d ffe (3 21 22)nosit a sem Aand B:and s.$6:no significant interac n-depthetad between any of the factors(fig.S5,A to D: cle of perceptual face processing =3.3.D>0.051 .p>09:identity x view TP are downstream from AM.their response (Fig.4C:see methods):faces versus nonfaces ldentity decoding 国同間 n=98 ' 200广406 Bin center(ms) Bin center(ms) 2B0 n=130 200 0 Bin center (ms) mulus o Familiar Untamilia chance 250 20 4.Sim s and early r tace pro inTPand AM for five contrasts Vertical bars om)fo Color area D)Fn ale ustime course of mon nformation in Th 200)and cro ode is shown at the top of the figure:the gray line sthe averag (B)Response latencies in TP(green)and AM(yellow)for al categories.The box TP(top)and AM(bottom)population res (top)fac )the most extre a p ons an M( Time Landi et al,Science 373,581-585(2021)30July 2021 4of 5two identity-preserving transformations: (i) indepth head rotation, a transformation that has been characterized in face areas, including AM, before (1); and (ii) geometric image distortion that does not affect familiar face recognition (20). We found that TP cells are as robust to in-depth rotation as AM cells: A three-way ANOVA with in-depth rotation, face identity, and area as factors yielded no significant interaction effects between any of the factors (fig. S5, A to D; view x identity x area F48,2535 = 0.201, p > 0.9; area x identity F12,2532 = 0.63, p > 0.8; area x view F4,2535 = 0.22, p > 0.9; identity x view F48,2532 = 0.34, p > 0.9). Geometric deformations had no distinctive effect on AM and TP population responses (fig. S5, E and F; two-way ANOVA with distortion type and area as factors, interaction effects F6,350 = 0.34, p > 0.9). The dominant models of face recognition (3, 21, 22) posit a sequential transition from perceptual face identity processing to face or person recognition. AM is located at the pinnacle of perceptual face processing (1), exhibiting an efficient code for physical face identity (11, 23). If face recognition units in TP are downstream from AM, their response latencies should be systematically longer. We tested this prediction in three analyses. First, population response latencies to the FOF stimulus set (Figs. 1D and 4, A and B; and fig. S1B) were not systematically different between face categories or areas [Fig. 4, A and B; and fig. S6; no significant interaction (F3,312 = 1.17, p > 0.3) or main effects for category (F3,312 = 0.93, p > 0.4) and brain area (F1,312 = 3.3, p > 0.05)]. Second, we analyzed performance time courses for five binary decoders in TP and AM (Fig. 4C; see methods): faces versus nonfaces Landi et al., Science 373, 581–585 (2021) 30 July 2021 4 of 5 1 Time (ms) 0 200 400 600 0 0.5 1 Norm. Response (A.U.) A TP Stimulus on Personally familiar Unfamiliar AM > 0 0.5 Norm. Response (A.U.) Time (ms) 0 200 400 600 Stimulus on Norm. accuracy (%) Bin center (ms) 0 200 400 600 p<0.005 50 10 30 20 40 B Accuracy (%) 70 Bin center (ms) p<0.005 0 200 400 600 chance 100 60 80p<0.005 Accuracy (%) chance C Face detection Species identification Human face familiarity Object familiarity Familiar Unfamiliar Norm. accuracy (%) Bin center (ms) 0 200 400 600 p<0.005 50 10 30 20 40 Bin center (ms) 0 200 400 600 D 90 Monkey face familiarity Familiar Unfamiliar vs. “Bobby” “Buster” vs. 50 100 150 200 250 Bin Center (ms) 50 60 70 80 Accuracy (%) chance 0 10 20 30 40 Norm. accuracy (%)50 50 100 150 200 250 Bin Center (ms) Monkey face familiarity Familiar monkey face identity E F Identity decoding 200 400 0 Latency (ms) Personally familiar Unfamiliar n=130 n=98 TP AM *** chance chance chance Fig. 4. Simultaneous and early familiar face processing in TP and AM. (A) Average normalized peristimulus time histograms for TP (top) and AM (bottom) for all categories. Color shading indicates SEM; the gray shaded area indicates the time period of significantly larger responses to familiar than unfamiliar monkey faces (permutation tests, 1000 iterations, p < 0.01). Color code is shown at the top of the figure; the gray line represents the average response to gray background images (no visual stimuli). A.U., arbitrary units. (B) Response latencies in TP (green) and AM (yellow) for all categories. The box plot shows the median ± 25% (boxes), the most extreme data points not considered outliers (whiskers), and the outliers (plotted individually). (C) Time courses of decoding performance of TP (top) and AM (bottom) population responses for five contrasts. Vertical bars below the plots indicate significant decoding accuracies (permutation tests, n = 200, p < 0.005; see methods). (D) Fine-scale peristimulus time course of monkey familiarity information in TP (green) and AM (yellow). Shaded regions are the SD of the decoding accuracies over all the shuffled trials (repeated n = 200) and cross-validation splits. The gray shaded region indicates significant differences between accuracies in AM and TP (permutation tests, n = 200, p < 0.005). (E) Time courses of decoding performance of TP (top) and AM (bottom) population responses for within-category (top) face identification (percentage of normalized classification accuracy). Populations and conventions are as in (C). (F) Fine-scale peristimulus time course of familiar monkey identity information in TP (green) and AM (yellow). Shaded regions are as in (D). RESEARCH | REPORT Downloaded from https://www.science.org at Southern Medical University on May 08, 2022