正在加载图片...
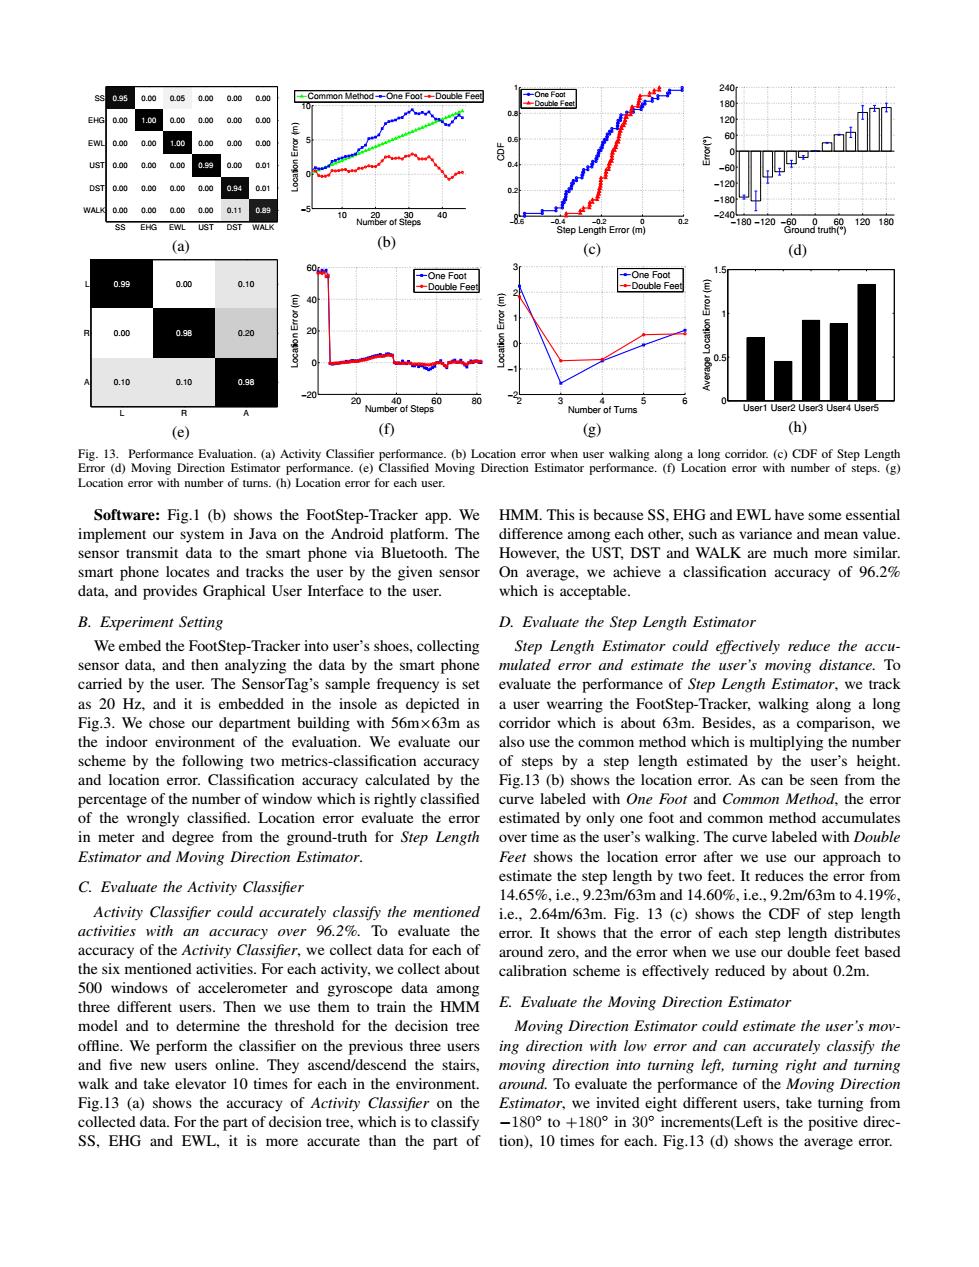
240 095 0.00 a05 0.00 0.00 0.00 -Common Method--One Foot--Double Feet 0.00 1.c0 a.00 0.c0 0.00 000 120 EWL 0.00 0.00 0.0 0.00 0.00 UST 0.00 0.00 0.01 0.00 0.0 a.00 0.00 0.9 0.01 80 0.00 0.00 a.00 0.000.11 09 10 40 SS EHG EWL UST DST WALK e Leng折Enor (a) (b) (c) (d) 60 15 -One Foot -One Foot 0.99 0.00 0.10 --Double Feet -Double Feet E E 0.00 0.98 0.20 20 0.10 0.10 0.98 20 Number of Step 80 6 Number of Tur User1 User2 User3 User4 User5 (e) (① (g) (h) Fig.13.Performance Evaluation.(a)Activity Classifier performance.(b)Location error when user walking along a long corridor.(c)CDF of Step Length Error (d)Moving Direction Estimator performance.(e)Classified Moving Direction Estimator performance.(f)Location error with number of steps.(g) Location error with number of turns.(h)Location error for each user Software:Fig.1 (b)shows the FootStep-Tracker app.We HMM.This is because SS,EHG and EWL have some essential implement our system in Java on the Android platform.The difference among each other,such as variance and mean value. sensor transmit data to the smart phone via Bluetooth.The However,the UST,DST and WALK are much more similar. smart phone locates and tracks the user by the given sensor On average,we achieve a classification accuracy of 96.2% data,and provides Graphical User Interface to the user. which is acceptable. B.Experiment Setting D.Evaluate the Step Length Estimator We embed the FootStep-Tracker into user's shoes,collecting Step Length Estimator could effectively reduce the accu- sensor data,and then analyzing the data by the smart phone mulated error and estimate the user's moving distance.To carried by the user.The SensorTag's sample frequency is set evaluate the performance of Step Length Estimator,we track as 20 Hz.and it is embedded in the insole as depicted in a user wearring the FootStep-Tracker,walking along a long Fig.3.We chose our department building with 56mx63m as corridor which is about 63m.Besides,as a comparison,we the indoor environment of the evaluation.We evaluate our also use the common method which is multiplying the number scheme by the following two metrics-classification accuracy of steps by a step length estimated by the user's height. and location error.Classification accuracy calculated by the Fig.13 (b)shows the location error.As can be seen from the percentage of the number of window which is rightly classified curve labeled with One Foot and Common Method.the error of the wrongly classified.Location error evaluate the error estimated by only one foot and common method accumulates in meter and degree from the ground-truth for Step Length over time as the user's walking.The curve labeled with Double Estimator and Moving Direction Estimator. Feet shows the location error after we use our approach to C.Evaluate the Activity Classifier estimate the step length by two feet.It reduces the error from 14.65%,i.e,9.23m/63mand14.60%,i.e,9.2m/63mto4.19%, Activity Classifier could accurately classify the mentioned i.e.,2.64m/63m.Fig.13 (c)shows the CDF of step length activities with an accuracy over 96.2%.To evaluate the error.It shows that the error of each step length distributes accuracy of the Activity Classifier,we collect data for each of around zero,and the error when we use our double feet based the six mentioned activities.For each activity,we collect about calibration scheme is effectively reduced by about 0.2m. 500 windows of accelerometer and gyroscope data among three different users.Then we use them to train the HMM E.Evaluate the Moving Direction Estimator model and to determine the threshold for the decision tree Moving Direction Estimator could estimate the user's mov- offline.We perform the classifier on the previous three users ing direction with low error and can accurately classify the and five new users online.They ascend/descend the stairs,moving direction into turning left,turning right and turning walk and take elevator 10 times for each in the environment. around.To evaluate the performance of the Moving Direction Fig.13 (a)shows the accuracy of Activity Classifier on the Estimator,we invited eight different users,take turning from collected data.For the part of decision tree,which is to classify -l80°to+l80°in30°increments(Left is the positive direc- SS.EHG and EWL,it is more accurate than the part of tion),10 times for each.Fig.13(d)shows the average error.0.95 0.00 0.00 0.00 0.00 0.00 0.00 1.00 0.00 0.00 0.00 0.00 0.05 0.00 1.00 0.00 0.00 0.00 0.00 0.00 0.00 0.99 0.00 0.00 0.00 0.00 0.00 0.00 0.94 0.11 0.00 0.00 0.00 0.01 0.01 0.89 SS EHG EWL UST DST WALK SS EHG EWL UST DST WALK (a) 10 20 30 40 −5 0 5 10 Number of Steps Location Error (m) Common Method One Foot Double Feet (b) −0.6 −0.4 −0.2 0 0.2 0 0.2 0.4 0.6 0.8 1 Step Length Error (m) CDF One Foot Double Feet (c) −180 −120 −60 0 60 120 180 −240 −180 −120 −60 0 60 120 180 240 Ground truth(°) Error( ° ) (d) 0.99 0.00 0.10 0.00 0.98 0.10 0.10 0.20 0.98 L R A L R A (e) 20 40 60 80 −20 0 20 40 60 Number of Steps Location Error (m) One Foot Double Feet (f) 2 3 4 5 6 −2 −1 0 1 2 3 Number of Turns Location Error (m) One Foot Double Feet (g) User1 User2 User3 User4 User5 0 0.5 1 1.5 Average Location Error (m) (h) Fig. 13. Performance Evaluation. (a) Activity Classifier performance. (b) Location error when user walking along a long corridor. (c) CDF of Step Length Error (d) Moving Direction Estimator performance. (e) Classified Moving Direction Estimator performance. (f) Location error with number of steps. (g) Location error with number of turns. (h) Location error for each user. Software: Fig.1 (b) shows the FootStep-Tracker app. We implement our system in Java on the Android platform. The sensor transmit data to the smart phone via Bluetooth. The smart phone locates and tracks the user by the given sensor data, and provides Graphical User Interface to the user. B. Experiment Setting We embed the FootStep-Tracker into user’s shoes, collecting sensor data, and then analyzing the data by the smart phone carried by the user. The SensorTag’s sample frequency is set as 20 Hz, and it is embedded in the insole as depicted in Fig.3. We chose our department building with 56m×63m as the indoor environment of the evaluation. We evaluate our scheme by the following two metrics-classification accuracy and location error. Classification accuracy calculated by the percentage of the number of window which is rightly classified of the wrongly classified. Location error evaluate the error in meter and degree from the ground-truth for Step Length Estimator and Moving Direction Estimator. C. Evaluate the Activity Classifier Activity Classifier could accurately classify the mentioned activities with an accuracy over 96.2%. To evaluate the accuracy of the Activity Classifier, we collect data for each of the six mentioned activities. For each activity, we collect about 500 windows of accelerometer and gyroscope data among three different users. Then we use them to train the HMM model and to determine the threshold for the decision tree offline. We perform the classifier on the previous three users and five new users online. They ascend/descend the stairs, walk and take elevator 10 times for each in the environment. Fig.13 (a) shows the accuracy of Activity Classifier on the collected data. For the part of decision tree, which is to classify SS, EHG and EWL, it is more accurate than the part of HMM. This is because SS, EHG and EWL have some essential difference among each other, such as variance and mean value. However, the UST, DST and WALK are much more similar. On average, we achieve a classification accuracy of 96.2% which is acceptable. D. Evaluate the Step Length Estimator Step Length Estimator could effectively reduce the accumulated error and estimate the user’s moving distance. To evaluate the performance of Step Length Estimator, we track a user wearring the FootStep-Tracker, walking along a long corridor which is about 63m. Besides, as a comparison, we also use the common method which is multiplying the number of steps by a step length estimated by the user’s height. Fig.13 (b) shows the location error. As can be seen from the curve labeled with One Foot and Common Method, the error estimated by only one foot and common method accumulates over time as the user’s walking. The curve labeled with Double Feet shows the location error after we use our approach to estimate the step length by two feet. It reduces the error from 14.65%, i.e., 9.23m/63m and 14.60%, i.e., 9.2m/63m to 4.19%, i.e., 2.64m/63m. Fig. 13 (c) shows the CDF of step length error. It shows that the error of each step length distributes around zero, and the error when we use our double feet based calibration scheme is effectively reduced by about 0.2m. E. Evaluate the Moving Direction Estimator Moving Direction Estimator could estimate the user’s moving direction with low error and can accurately classify the moving direction into turning left, turning right and turning around. To evaluate the performance of the Moving Direction Estimator, we invited eight different users, take turning from −180◦ to +180◦ in 30◦ increments(Left is the positive direction), 10 times for each. Fig.13 (d) shows the average error