正在加载图片...
Theorem 5.Assume each edge is hashed by the DBH method with dmin.vi.di and hin defined above.The vertices are evenly assigned.By taking the constant 2E/p nEp d/p,there exists e (0,1)such that the expected edge-imbalance of DBH 1i=1 on p machines can be bounded w.h.p(with high probability).That is, +max (d:-h) ≤1+e)2 va∈P p Note that any e that satisfies 1/en/p could work for this theorem,which results in a tighter bound for large n.Therefore,together with Theorem 4,this theorem shows that our DBH method can reduce the replication factor and simultaneously guarantee good workload balance. 5 Empirical Evaluation In this section,empirical evaluation on real and synthetic graphs is used to verify the effectiveness of our DBH method.The cluster for experiment contains 64 machines connected via 1 GB Ethernet. Each machine has 24 Intel Xeon cores and 96GB of RAM. 5.1 Datasets The graph datasets used in our experiments include both synthetic and real-world power-law graphs. Each synthetic power-law graph is generated by a combination of two synthetic directed graphs.The in-degree and out-degree of the two directed graphs are sampled from the power-law degree distribu- tions with different power parameters a and B,respectively.Such a collection of synthetic graphs is separated into two subsets:one subset with parameter a>B which is shown in Table 1(a),and the other subset with parameter a<B which is shown in Table 1(b).The real-world graphs are shown in Table 1(c).Some of the real-world graphs are the same as those in the experiment of PowerGraph And some additional real-world graphs are from the UF Sparse Matrices Collection [6]. Table 1:Datasets (a)Synthetic graphs:a >B (b)Synthetic graphs:o<B (c)Real-world graphs Alias E Graph V■E■ 10 8.67 Twitter [11] 42M1.47B 2.2 2.1 88.305.754 51 2.0 2.2 135998.03 Arah Arabic-2005 [6] 22M0.6B 34.81233 12 1 1453U7,486 w② 57M130 273369812 1.9 8.645 WG WebGoogle【3 S.IM 2. 2 64.602848 15 1.9 27.718,498 2.1 20.316.909 0 g562 2.01.9310.763862 5.2 Baselines and Evaluation Metric In our experiment,we adopt the Random of PowerGraph [7]and the Grid of GraphBuilder [9] as baselines for empirical comparison.The method Hybrid of PowerLyra [4]is not adopted for comparison because it combines both edge-cut and vertex-cut which is not a pure vertex-cut method. One important metric is the replication factor,which reflects the communication cost.To test the speedup for real applications,we use the total execution time for PageRank which is forced to take 100 iterations.The speedup is defined as:speedup=100%x (YAlg-YDBH)/YAlg,where YAlg is the execution time of PageRank with the method Alg.Here,Alg can be Random or Grid.Because all the methods can achieve good workload balance in our experiments,we do not report it here. GraphLab 2.2 released in July 2013 has used PowerGraph as its engine,and the Grid GP method has been adopted by GraphLab 2.2 to replace the original Random GP method.Detailed information can be found at: http://graphlab.org/projects/index.html >Theorem 5. Assume each edge is hashed by the DBH method with dmin, {vi} n i=1, {di} n i=1 and {hi} n i=1 defined above. The vertices are evenly assigned. By taking the constant 2|E|/p = ED Pn i=1 di = nED [d] /p, there exists ∈ (0, 1) such that the expected edge-imbalance of DBH on p machines can be bounded w.h.p (with high probability). That is, EH,D Xn i=1 hi p + max j∈[p] X vi∈Pj (di − hi) ≤ (1 + ) 2|E| p . Note that any that satisfies 1/
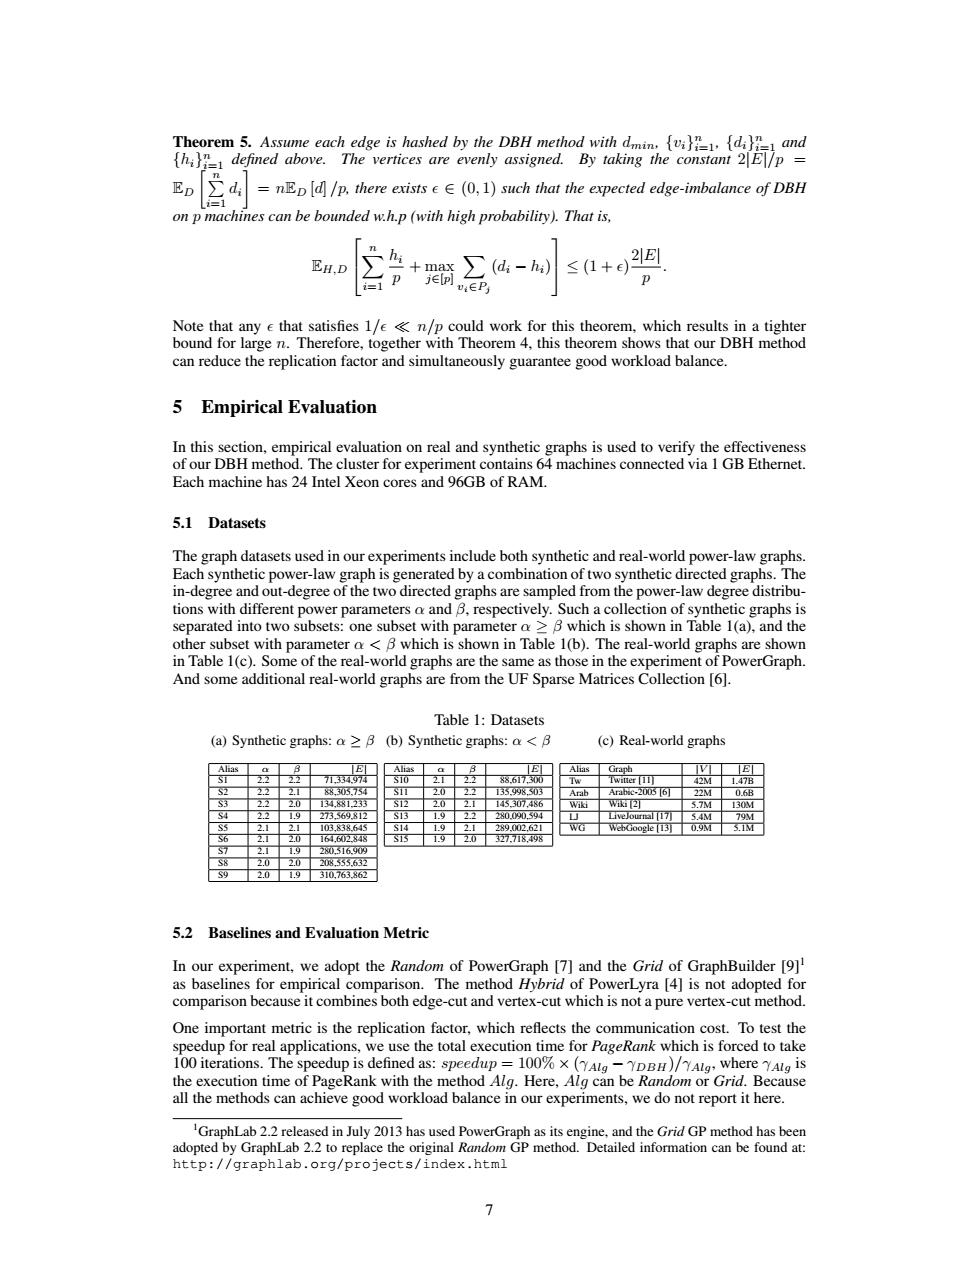
n/p could work for this theorem, which results in a tighter bound for large n. Therefore, together with Theorem 4, this theorem shows that our DBH method can reduce the replication factor and simultaneously guarantee good workload balance. 5 Empirical Evaluation In this section, empirical evaluation on real and synthetic graphs is used to verify the effectiveness of our DBH method. The cluster for experiment contains 64 machines connected via 1 GB Ethernet. Each machine has 24 Intel Xeon cores and 96GB of RAM. 5.1 Datasets The graph datasets used in our experiments include both synthetic and real-world power-law graphs. Each synthetic power-law graph is generated by a combination of two synthetic directed graphs. The in-degree and out-degree of the two directed graphs are sampled from the power-law degree distributions with different power parameters α and β, respectively. Such a collection of synthetic graphs is separated into two subsets: one subset with parameter α ≥ β which is shown in Table 1(a), and the other subset with parameter α < β which is shown in Table 1(b). The real-world graphs are shown in Table 1(c). Some of the real-world graphs are the same as those in the experiment of PowerGraph. And some additional real-world graphs are from the UF Sparse Matrices Collection [6]. Table 1: Datasets (a) Synthetic graphs: α ≥ β Alias α β |E| S1 2.2 2.2 71,334,974 S2 2.2 2.1 88,305,754 S3 2.2 2.0 134,881,233 S4 2.2 1.9 273,569,812 S5 2.1 2.1 103,838,645 S6 2.1 2.0 164,602,848 S7 2.1 1.9 280,516,909 S8 2.0 2.0 208,555,632 S9 2.0 1.9 310,763,862 (b) Synthetic graphs: α < β Alias α β |E| S10 2.1 2.2 88,617,300 S11 2.0 2.2 135,998,503 S12 2.0 2.1 145,307,486 S13 1.9 2.2 280,090,594 S14 1.9 2.1 289,002,621 S15 1.9 2.0 327,718,498 (c) Real-world graphs Alias Graph |V | |E| Tw Twitter [11] 42M 1.47B Arab Arabic-2005 [6] 22M 0.6B Wiki Wiki [2] 5.7M 130M LJ LiveJournal [17] 5.4M 79M WG WebGoogle [13] 0.9M 5.1M 5.2 Baselines and Evaluation Metric In our experiment, we adopt the Random of PowerGraph [7] and the Grid of GraphBuilder [9]1 as baselines for empirical comparison. The method Hybrid of PowerLyra [4] is not adopted for comparison because it combines both edge-cut and vertex-cut which is not a pure vertex-cut method. One important metric is the replication factor, which reflects the communication cost. To test the speedup for real applications, we use the total execution time for PageRank which is forced to take 100 iterations. The speedup is defined as: speedup = 100% × (γAlg − γDBH)/γAlg, where γAlg is the execution time of PageRank with the method Alg. Here, Alg can be Random or Grid. Because all the methods can achieve good workload balance in our experiments, we do not report it here. 1GraphLab 2.2 released in July 2013 has used PowerGraph as its engine, and the Grid GP method has been adopted by GraphLab 2.2 to replace the original Random GP method. Detailed information can be found at: http://graphlab.org/projects/index.html 7