正在加载图片...
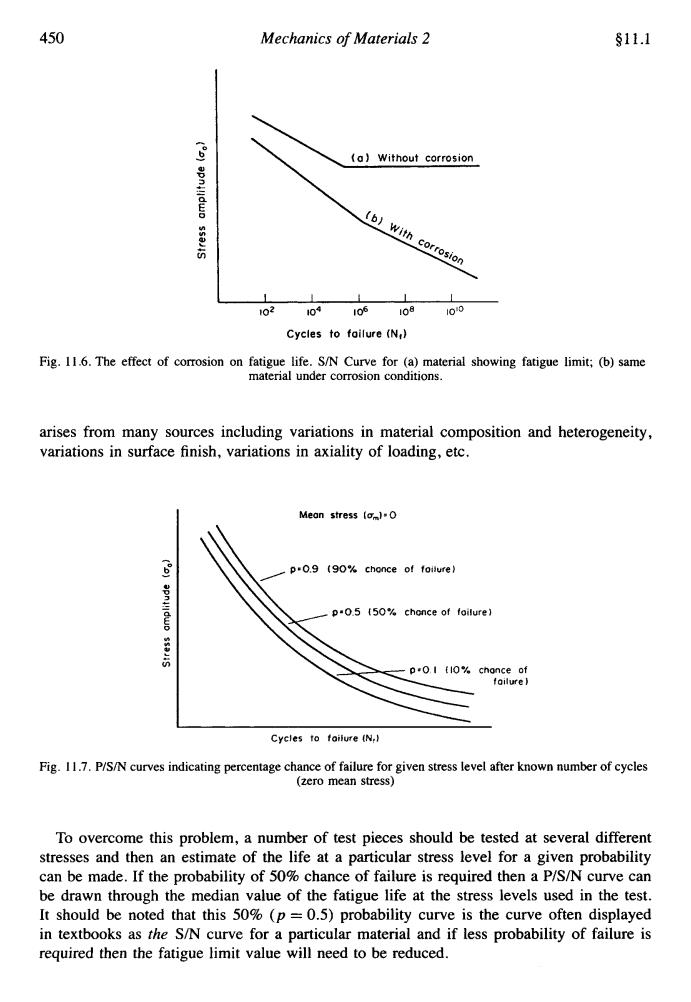
450 Mechanics of Materials 2 §11.1 (p)apnilldwo 《a】Without corrosion ssa/IS (b】with corrosion 102 104 106 100 Cycles to foilure (N,) Fig.11.6.The effect of corrosion on fatigue life.S/N Curve for (a)material showing fatigue limit;(b)same material under corrosion conditions. arises from many sources including variations in material composition and heterogeneity, variations in surface finish,variations in axiality of loading,etc. Mean stress【g.1-0 E p.0.9 (90%chonce of foilure) p0.5 (50%chonce of foilure) ssaJiS p0.I (10%chonce of foilure) Cycles to foilure (N) Fig.11.7.P/S/N curves indicating percentage chance of failure for given stress level after known number of cycles (zero mean stress) To overcome this problem,a number of test pieces should be tested at several different stresses and then an estimate of the life at a particular stress level for a given probability can be made.If the probability of 50%chance of failure is required then a P/S/N curve can be drawn through the median value of the fatigue life at the stress levels used in the test. It should be noted that this 50%(p =0.5)probability curve is the curve often displayed in textbooks as the S/N curve for a particular material and if less probability of failure is required then the fatigue limit value will need to be reduced.450 Mechanics of Materials 2 $11.1 102 lo4 106 108 io1O Cycles to failure (N,) Fig. 11.6. The effect of corrosion on fatigue life. S/N Curve for (a) material showing fatigue limit; (b) same material under corrosion conditions. arises from many sources including variations in material composition and heterogeneity, variations in surface finish, variations in axiality of loading, etc. Mean stress luml=O - - bo V u - 0'05 150% chonce of foilure) - a s v1 u 0) foilure I Cycles to foilure IN,) Fig. 11.7. P/S/N curves indicating percentage chance of failure for given stress level after known number of cycles (zero mean stress) To overcome this problem, a number of test pieces should be tested at several different stresses and then an estimate of the life at a particular stress level for a given probability can be made. If the probability of 50% chance of failure is required then a P/S/N curve can be drawn through the median value of the fatigue life at the stress levels used in the test. It should be noted that this 50% (p = 0.5) probability curve is the curve often displayed in textbooks as the S/N curve for a particular material and if less probability of failure is required then the fatigue limit value will need to be reduced